As of year-end 2024 the overall CRE markets were settling into a new normal with higher interest rates and generally lower transactions volumes. Turning the page to 2025, we see opportunities for improvement across all CRE sectors and overall optimism is prevalent in most, if not all, of our conversations with our peers and investors. The TEAM has completed several strategic refinancing’s in a difficult capital environment. Several of our industrial target markets are setting new demand records as of year-end 2024; there’s limited new supply in the queue, and we are in the early innings of seeing the fruits of our labor in 2022 and 2023 come to realization as leasing activity continues to strengthen within our recently delivered industrial projects. We continue to find new industrial development opportunities across the Southeast and Texas markets, specifically the Raleigh/Durham corridor and the Houston MSA.
In this report we cover several items including 1) continued mark-to-market opportunities across the existing Class A & B industrial assets, 2) a brief summary of the overall U.S. industrial fundamentals and potential equilibrium on the horizon, and 3) continued e-commerce growth comparative to brick-mortar stores and how this translates to future industrial demand. Lastly, we provide a few relevant take-aways regarding Mexico’s increasing presence as the U.S. #1 trade partner through past and current administrations trading policies and how this will assist in demand within the Sunbelt and our Texas markets, specifically the border towns of El Paso and Laredo that we are continuing to monitor in order to make strategic investments within these neighboring cities just outside the “Texas Triangle.”
The Table of Contents below can assist with navigating to a preferred section or getting a quick general take.
- Fund Updates: High level news on Fund activity.
- Real Estate Market Conditions: In this section, we will review:
- Is "Mark to Market" For Real?
- Nearing the Industrial Equilibrium?
- E-commerce continues...
- US/Mexico Trade skyrockets!
- Macro Economic Conditions:
- Texas
- Overhauling the World's Financial Plumbing
Fund Updates
Fund IV:
Creekside Logistics, Raliegh/Durham, NC: We are happy to report that we’ve closed on our first speculative industrial development tract in North Carolina totaling 25.6 acres, Creekside Logistics, just outside Raleigh/Durham in 3Q2024. The site is strategically located along the south side of Interstate 40, approximately 20 minute drive from the Raliegh/Durham market within the I-40/I-85 corridor. The site provides direct access to I-40 off Buckhorn Road via a diamond interchange. This two-building, rear-load Class A industrial project totals 196,827 square feet (SF) and will be delivered in December 2025. The smaller building, 520’ wide x 165’ deep totals 85,103 SF while the larger building is 520’ wide x 215’ deep, totals 111,724 SF. Tenant suite sizes can be demised down to a small as +/-17,000 SF. The property includes 237 auto parking spots, 130’ truck courts, ESFR sprinklers, 60’ speed bays, and 32’ clear heights.
Airport Boulevard Industrial, Houston, TX: The TEAM closed on this new industrial development tract on December 30, 2024. This 17.8 acre land tract is strategically located in South Houston, at the SE/C of Airport Blvd and Almeda Rd, just west of Highway 288 (Hwy. 288). The site provides direct access off Hwy. 288 via Airport Blvd. just 2+ miles south of Interstate Loop 610. The TEAM will deliver a single front-load Class-A industrial building totaling 224,700 SF with construction beginning in May 2025. The single building is 870’ x 250’ deep with a 185’ truck court and 61 trailer parking spaces.
Real Estate Market Conditions
The following are our latest observations on current commercial real estate (“CRE”) market conditions.
U.S. Industrial Fundamentals – A brief snapshot of important metrics:
Is “Mark to Market” For Real?: Crow Holdings Capital year-end 2024 report provided an interesting graphic detailing overall mark to market opportunities (In-Place rents significantly below Market Rents) supporting our strategy to continue invest in existing Class A & B industrial cash flowing assets providing the ability to push overall NOI growth as leases “turnover” or “rollover” in the next several years. The graph below provides a view of the real time gap between in-place rents compared to market rents.
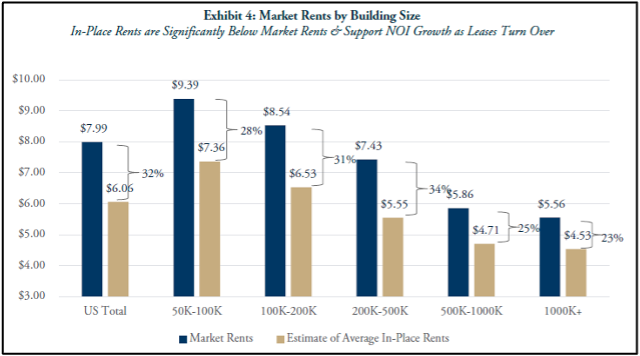
As we continue to bid on existing industrial assets on behalf of Fund IV as well as within our future series of Funds, we’ve witnessed significant rent appreciation in the last several years. Based on the rent roll data in our proprietary database, we have observed that certain assets continue to exhibit "sticky" rent rolls, meaning they have had strong historical occupancy over the past decade. This suggests that even significant rent increases result in limited tenant turnover when the property meets their business needs.
As the graph details, the US overall has in-place rents that are significantly below market rents by approximately 32%! The largest spread in the ranges detailed in the graph are tenants ranging in size from 50,000 sf up to 500,000 SF. It’s no coincidence that we are continuing to build as well as doing our best to buy existing assets with tenants that range in size from around 50,0000 sf to 250,000 SF, a sweet spot for mark-to-market rent opportunities as well as net new demand for this size requirement.
Click here to request the full Q4 2024 Report.
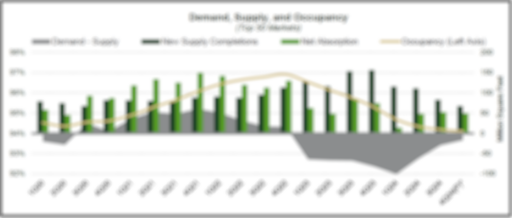
Nearing the Industrial Equilibrium: Per GreenStreet’s YE2024 report, supply and demand fundamentals were dismal as of the end of 1Q2024; since that time overall demand across the U.S. has been stable with approximately ~50 million SF per quarter of net absorption from 2Q through 4Q2024, a bit below the ’13 to ’19 quarterly pace of ~80 million SF. As seen in the bar graph close by, since YE2022 new supply has outpaced net new demand. The run-up of new construction began in late 2022 (Dark Green Bar (New Supply Completions) doubling in size versus the Light Green Bar (Net Absorption). The new supply trend has since slowly leveled off into the middle of 2024 due to the rise of interest rates in late 2022 and 2023 and the lack of liquidity for developers. Per GreenStreet’s Industrial Sector Takeaways and Prologis (PLD) inaugural ’25 guidance, both are expecting supply completions to fall 35% year-over-year in ’25, with supply starts down 70% from peak levels.
The national vacancy rate should top out in 1Q25 or 2Q25, assuming demand does not deteriorate. The continued dwindling supply across the US has allowed for an uptick in overall rent growth to continue as well as position several of our target markets, specifically Houston, Dallas and Nashville for the TEAM to lean hard into finding new sites for new development. For example, as we mentioned in our latest Fund IV update, we were able to secure a new 18+ acre site in South Houston for a new speculative single front-load Class-A industrial building totaling 224,700 SF with construction beginning in May 2025.
E-commerce continued…: For over a decade there have been continued tailwinds for e-commerce growth across the country. While 2020 was anomaly due to a world health crisis and everyone “sheltering in place” (as we say down in Texas due to hurricanes), the general population did this for months on end, which created a massive waive of e-commerce throughout the world. This resulted in significant warehouse demand (depicted in the bar graph nearby). While not the highs depicted in 2020 and 2021, projected Ecommerce driven warehouse demand, per GreenStreet’s latest YE2024 report, shows material growth averaging 30% of net new demand across the US for the next three years.
Click here to request the full Q4 2024 Report.
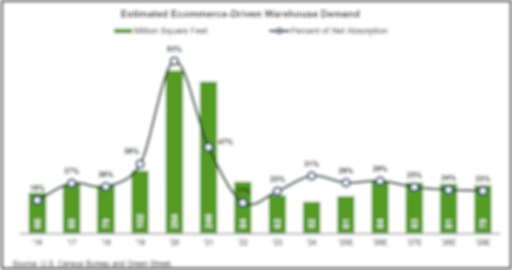
You may have heard this before from GreenStreet and other thought leaders in the industrial space, E-commerce requires a factor of 3x the amount of warehouse space as Brick & Mortar retail per dollar of sales. The primary reason for the increased amount is the immense number of products being processed with a massive volume of individual orders in comparison to traditional Brick & Mortar stores. For example, last year e-commerce sales, per the U.S. Census Bureau, in the third quarter of 2024, reached approximately $300.1 billion, accounting for 16.2% of total retail sales across the U.S. This represents a 2.6% increase from the previous quarter and a 7.4% rise compared to the same quarter in 2023. Setting aside new supply coming online, as well as existing stock, this amount of sales volume would require approximately 375,000,000 million SF of new industrial space if none were available today. In short, while we will not see another run up of e-commerce sales like occurred in 2020 and 2021, we have a strong belief that e-commerce will continue to provide tailwinds for years to come for new and existing industrial demand.
Will Demand patterns increase? U.S. trade volume increases translate to positive net new demand for industrial space. The continued growth of U.S. ports, with 16% year-over-year change in 2024, per GreenStreet’s U.S. Industrial Outlook (Jan’25) at Major Seaports, spells continued demand for the industrial sector. The report indicates Houston and Savannah have experienced the greatest uptick in volumes since the pandemic (YE 2019) as well as the largest gains for the last decade as can be seen in the TEU graph nearby. While various publications are signaling a slowdown in overall demand in ’25, the Gulf Coast and Eastern seaboards have benefited the most over the last decade from continued port expansions.
Click here to request the full Q4 2024 Report.
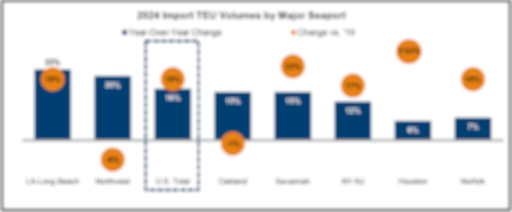
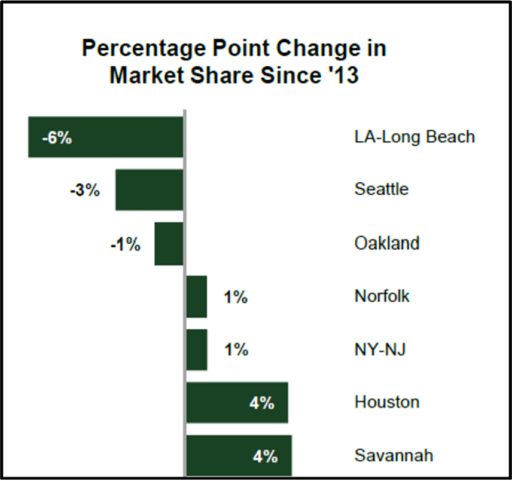
So much so, that West coast ports have witnessed a steady decline in market share relative to their peers in the Gulf and Eastern ports. We believe this “demand grab” will continue with the continued expansions of both Houston and Savannah port terminals coupled with the previous expansion of the Panama Canal almost a decade ago allowing the Gulf and Sunbelt port markets to see the long-term benefits in gaining market share.
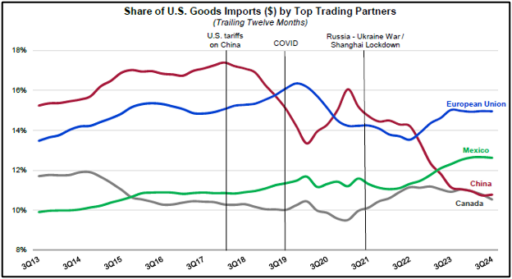
U.S. / Mexico Trade Skyrockets: Various sources including CBRE, GreenStreet and a recent report from Invesco, detail how global trade and specifically manufacturing industries (some tied to the Chips and Inflation Act) have witnessed explosive growth due to the shifting U.S. policy away from long time trading partner, China. Over the course of the last 7+ years the U.S. has increased onshore manufacturing and increased trade volumes with countries outside of China, specifically Mexico, the European Union (EU), Japan, Germany and Canada. As seen in the graphic nearby, between 3Q22 and 3Q23, the European Union (EU) and Mexico eclipsed China as the Top Trading Partner of the U.S. The share of U.S. Good imports shifted away from China beginning in +/-2018, with almost 20% of all US Good Imports from China to now just above a 10% share by China. This is a monumental shift (see Macro Economic Conditions below), and is specifically significant for U.S./Mexico border activities.
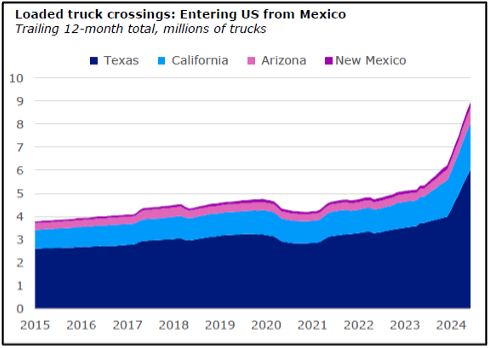
Due to this increase trade volume, Mexico’s exports to the U.S. represent approximately 30% of Mexico’s GDP (per Invesco U.S./Mexico Border Trade Overview December 2024). With the U.S. as the primary investor into Mexico this will continue to grow via key sectors that include Autos, Electronics/Appliances & Medical Equipment. The industrial markets along the Mexican border with the U.S. that include Monterrey, Saltillo and Juarez have extremely tight Industrial fundamentals. For example, per CBRE latest YE 24 report, vacancies in Monterrey are hovering around 3.0%. With these strong fundamentals on the Mexican side of the border the “spill-over” effect is real. The graph nearby shows a clear acceleration, starting in early 2023 and rapidly growing in 2024, of loaded truck crossings into the U.S. from Mexico. The volume increased almost two-fold, with around 5 million loaded trucks in early 2023 to almost 9 million by YE2024. Texas alone (the dark purple area in the graph) accounts for over 60% of this loaded truck traffic with just under 6 million loaded truck crossings as YE2024.
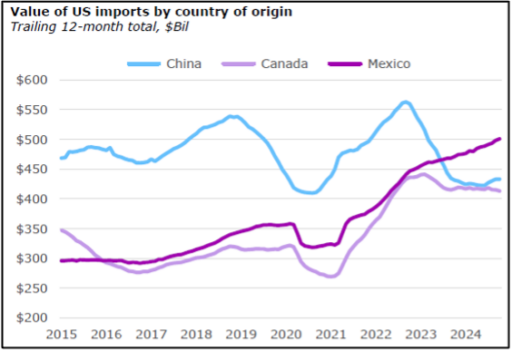
While loaded truck traffic is important, what is within these containers helps drive the industrial demand. The value of U.S. imports from our trade partners, specifically Mexico, has increased substantially from 2021 through YE2024. Some of that increase can be attributed to inflation, but it is interesting to note that while Canada has leveled off since 2023, and China’s trade volume into the US has dwindled, Mexico has continued to increase the value of exports to the U.S. There is some uncertainty with the new administration and its saber rattling on tariff’s, but our view is the trend of investment in and imports from Mexico will continue for the foreseeable future.
These positive metrics should support growing industrial demand within our Texas markets, and also in the border towns of El Paso and Laredo. We are continuing to monitor the two border markets in search of opportunities to make strategic investments within those two cities that reside just outside the “Texas Triangle” of Austin, San Antonio, Dallas and Houston. Sources for this U.S. / Mexico Trade Explosion section include Invesco Real Estate US / Mexico Border Trade Overview, data from US Census Bureau, US Department of Transportation, Moody’s Analytics and Oxford Economics as of December 2024.
Macro-Economic Conditions
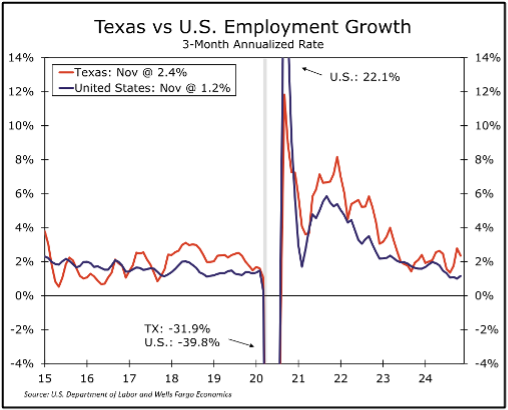
Because the Real Estate Market Conditions section ended with a focus on Texas (and Mexico), it seems fitting to start our commentary on Macro Economic Conditions with a quick look at Texas. The Texas economy is stabilizing after rapid growth in recent years, with real GDP expanding at a 4.2% annualized rate in Q3-2024, outpacing the national average of 3.1%. Since Q4-2019, Texas' real GDP has grown by 18.7%, compared to the U.S. growth of 11.5%. Non-farm payroll growth has slowed but remains above the national average. In November 2024, Texas added 9,100 new jobs, with total non-farm payrolls up 2.4% on a three-month annualized rate compared to 1.2% for the nation.
The unemployment rate has risen slightly to 4.2%, reflecting a loosening labor market. Hiring has slowed in industries sensitive to interest rate changes, such as transportation and utilities, manufacturing, and oil & gas. However, services sector hiring remains resilient, supported by strong population growth and favorable demographics. The professional and business services, education and healthcare, and leisure and hospitality sectors are performing well, while retail and government employment growth remains slow.
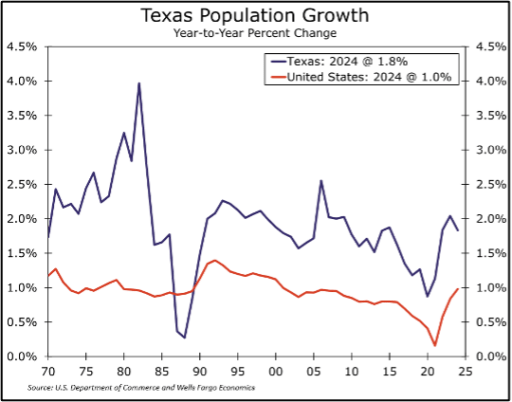
Texas' population grew by 1.8% in 2024, adding nearly 563,000 people, driven by both domestic and international migration. The state's population is now estimated at 31 million residents. Wow!
The Texas real estate market has softened due to high mortgage rates, with home sales and new residential construction declining from their peaks. However, home price appreciation has cooled, and the multifamily vacancy rate is stabilizing as demand for apartments strengthens. The commercial real estate market shows stability with positive net absorption for office space in Dallas and Austin, and strong industrial demand in Dallas and Houston.
Overall, the Texas economy is transitioning to a more stable growth phase, with strong fundamentals supporting its future prospects. [Sources: Primarily Wells Fargo Economics]
And Now For Something Completely Different …..
Overhauling the World’s Financial Plumbing
The economic conditions we have enjoyed since the brief recession in 2020 are coming to an end. Global capital and currency flows are shifting as the basic framework of the world financial order in place since the end of World War II is being overhauled to eventually be replaced by a new system. The orders of magnitude are significant.
The process started almost a decade ago and would be underway regardless of what party is in power in Washington. Treasury Secretary, Janet Yellen, during the last half of the Biden Administration pushed roughly $6 trillion dollars into the economy and markets by issuing mostly short-term T-bills (1-year maturity or less) and running down the Treasury’s checking account at the Federal Reserve, which helped offset a $2 trillion dollar contraction orchestrated by the Federal Reserve through quantitative tightening and higher short-term rates choking off bank lending. What Yellen should have done is issue almost exclusively 30-year bonds when rates were extremely low in 2021 and early 2022. John Mauldin has said: “Treasury Secretary Yellen’s management of government debt is the single worst mismanagement since Alexander Hamilton. Not issuing 30-year notes in the 1% range was criminally stupid.” Partially in her defense, the changing global economic order has significantly diminished the world’s appetite for long-term U.S. Treasury obligations. More on that in a moment, but first, where are we?
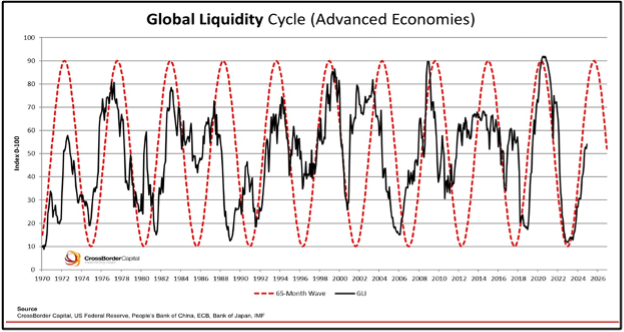
As 2025 begins, U.S. financial conditions are running on fumes, and additional liquidity will be needed to sustain asset prices and economic activity. However, we are nearing a peak on overall global liquidity that will be hard to sustain and is more likely to reverse. The liquidity cycle is crucial for markets and asset prices. The chart nearby shows the recent global liquidity cycles indexed against a theoretical 65-month wave and indicates we are likely approaching a peak. The chart is from Michale Howell at Capital Wars.
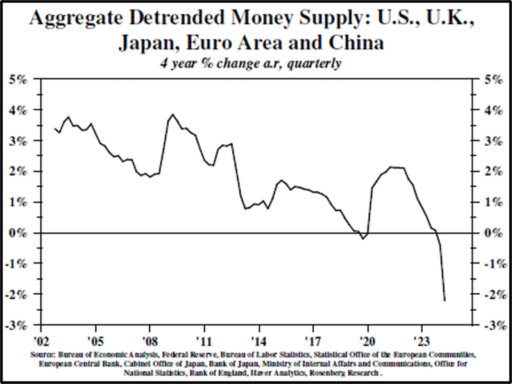
The early decade surge in underlying global liquidity has goosed economic growth and lifted most asset prices as well as driven inflation. But the tide is now going out. Lacy Hunt points out that the aggregate growth rate in the developed economies’ money supply turned negative in 2024. See the chart nearby. It is the rate of change, rather than levels, which matters most.
This course reversal is happening simultaneously with a fundamental restructuring of the global monetary system, a process that began in 2016. The implications of this restructuring are likely why Scott Bessent, a nerd about global monetary systems, became Treasury Secretary. The U.S. needs to continue this course correction for good reasons. The world is waking up to the fact that we now reside in a hard power world, and soft power has lost its relevance. Trump talks directly to specific European countries rather than Brussels. Europe, with its poor energy and industrial policies, is changing its capital allocation quickly. The U.K. has committed to putting boots on the ground in Ukraine, recognizing the need to be at the table in global negotiations.
Countries that want to prosper in the new era must spend more on defense and secure their energy sources, preferably with friends rather than foes, and preferably with sources that make economic sense. Market volatility will increase as a result, with markets anticipating these changes [credit: Chris Wallis at Vaughan Nelson].
The U.S. needs to rebalance its manufacturing base and defense industrial base, which requires among other things, a weaker dollar. This adjustment may be done unilaterally or with allies. Tariffs, the U.S. Dollar, security guarantees, trade deficits, Federal Government deficits, and tax policy are all interconnected and will need to change. The question is how, when, and over what duration these changes will occur, and what the collateral damage or opportunities will be.
Historically, the U.S. proposed, and the western democracies acquiesced to a deal post-World War II in which the U.S. would open its economy in exchange for other countries buying U.S. treasuries and trading goods in U.S. dollars, especially oil (arguably the world’s most important currency). This arrangement worked well until China joined the WTO in late 2001. Since then, the U.S. economy has struggled to absorb the developing world's manufacturing while maintaining its role as the global policeman. The world began to change in 2016 when central banks outside the U.S. began to slow their accumulation of long-term U.S. Treasury securities, the beginning of the current restructuring of global capital flows and reserves. Gold, one of the best performing assets for the last 2 years, is making multi-decade highs, an indication that the monetary system is changing. Gold is the third largest central bank reserve asset globally, and in aggregate central banks are subtly accumulating more. Also, while only marginally at this point, oil is beginning to trade in currencies other than the dollar, a critical change if non-dollar oil trade grows significantly.
The U.S. has relied on deficit spending since 2016 to grow its economy, but this approach has reached a point where every incremental deficit dollar borrowed has a negative economic output multiplier. Keynes did not anticipate this possibility. From this point, the U.S. will struggle to maintain low taxes and high real growth simultaneously. Trump's plan may be to risk real growth temporarily while keeping taxes low. Tariffs are just another tax. Tariffs are a consumption tax, which most economists argue are more efficient than an income tax. Pundits can argue about who pays the tariff tax, but they do generate revenue for the Federal Government. Tariffs and a decline in the U.S. Dollar are very likely to cause a one-time increase in inflation but will not drive ongoing inflationary pressures.
Economic headwinds in the U.S. include proposed spending cuts from the Federal Government. The U.S. has a 2025 projected GDP of $30 trillion (CBO). Sober estimates suggest budget cuts of $400 to $500 billion dollars of government spending will be required to maintain our current tax regime and fund entitlements for the intermediate term. This size of spending cuts represents slightly less than a 2% contraction in real GDP. The Trump administration appears to be trying to pull back on public spending and accelerating private investment to offset reduced fiscal stimulus, creating volatility and hesitation due to uncertainties around tariffs and other elements. Assuming a negative multiplier, the intermediate impact on growth from reduced public spending may be less than some fear.
DOGE looks to be off to a good start, but $400+ billion is a tall task. Assuming DOGE doesn’t have to play whack-a-mole following the “deletion” of USAID, and assuming the reported approximate number of 100,000 federal employes taking early retirement is correct, then that is indeed a credible start towards reduced public spending. There will be wailing and gnashing of teeth, but so far, the politics of right sizing the Federal Government seem to be holding up.
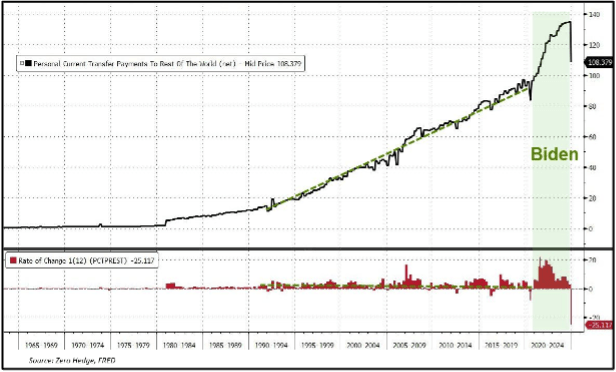
Speaking of those politics, take a look at the nearby chart showing the Personal Current Transfer Payments the U.S. has been making to the rest of the world. Notice anything interesting about the rate of growth of those payments during the previous administration. No doubt some of those payments were for good cause(s) and will hopefully continue under different management, but at least returning to the prior rate of increase can’t be a bad thing. Lower short-term interest rates will also likely contribute to a reduction in Federal Government spending as Treasury bills and notes issued in 2022–2024 roll off and are reissued at lower rates. The savings could be as much at $100 billion per annum. There will also likely be a surge in capital gains tax receipts this year as some of the outsized gains in the stock market from the past two years are realized.
While much of the change in the world’s financial plumbing can be characterized as “deglobalization”, no major developed country is isolated, and the world economy is and will remain interconnected to a degree that no nation can be insulated from global conditions. As such, we should note there are global economic headwinds as well. Factories across the world continue to become increasingly inactive, in part because “reshoring” renders previously installed “offshore” capacity redundant. From Hoisington Investment Management’s recent quarterly letter: “Global industrial capacity utilization (CAPU) has fallen significantly, and a rising unemployment rate has followed suit.
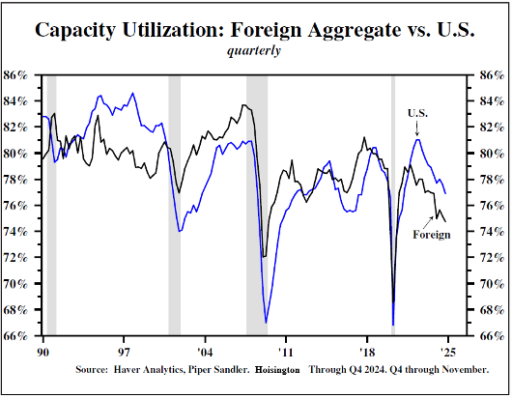
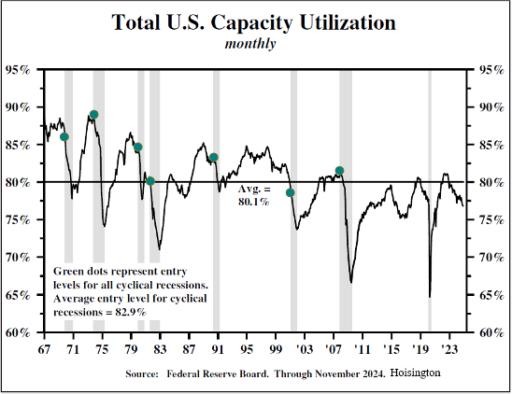
The reason this is relevant is that since 1990, this thirty-four year correlation is consistent with the U.S. experience where data has been available for seven decades. (1st of two nearby charts) As such, CAPU appears to be the dominant supply-side variable in determining inflation in the United States, China, Japan, U.K. and the EU. In the United States, CAPU has plummeted to levels lower than at the start of all of the cyclical recessions since 1967 (2nd of two nearby charts). This vividly reflects a significant underutilization of resources, a circumstance which has historically led to moderating economic growth. Based on nearly complete fourth quarter 2024 data, the U.S. CAPU is estimated to have been 76.9%, a significant 3.2 percentage points lower than the post-1967 average and 6 percentage points below the historical level of 82.9%, which is the average entry level for the cyclical recessions. This surplus capacity reflects an irregular cyclical decline in industrial production from the fall of 2022.”
John Mauldin: “With excess capacity relative to demand, we essentially have “too little money chasing too many goods.” If it persists, this will mean lower growth, disinflation, and falling interest rates. At dinner on Monday, Robert Graham, a partner at TBG, asked how long the lag would be before that disinflation takes effect. Lacy [Hunt / Hoisington] said it might be as long as four years. Monetary policy has always worked with a long lag.”
In summary, our take is to anticipate lower short-term rates late in 2025 and into 2026, perhaps closer to the Fed’s median dot plot of 100 basis points than the 50 basis points the [SOFR] futures market is forecasting (Chatham Financial), but higher for longer on the long-end of the interest rate curve, despite the recent 50 basis point decline in the UST 10-year.