The last quarter of 2018 was a very busy time for the team. For the 2018 calendar year we closed 5 (five) purchase transactions for Fund III investors, and our last quarter of the year was at a fever pitch reviewing multiple opportunities and closing two of the five transactions, both new office acquisitions. Fund III was also in escrow to complete a small build-to-suit industrial manufacturing facility in East Houston which closed in January and is now under construction. Lastly, as briefly noted in our last report, we closed out the year with an asset in non-refundable escrow to sell, One Agave Center in Tempe, AZ (Fund II asset). Details follow on each of these transactions below.
Over the past 18+ months, our operating mode has been “cautiously optimistic” considering the back drop of what many were thinking of as an economic inflection point as of year-end 2017. That caution was no different in 2018. While we have a strong appetite to invest, we continue to remain disciplined in our way of thinking particularly about average lease duration (weighted average lease term or “WALT”) and tenant or customer credit quality, and always driven by a keen focus on historical occupancy and rent growth. Further, 2017 was a year in which we sold several large assets to capitalize on our collective gains for you. So, what “macro” direction are we pivoting towards since our last year-end report in Q4-2017? The upshot for those of you that will not read any further, we’ve made a definitive shift to the other side of the hill and the economists we follow and key decision makers we interact with daily feel we’ve pushed beyond historical duration for economic expansion, and therefore a pullback is likely on the horizon. We would call this period of time a “double header” with the potential for extra innings. We remain sharply focused on downside protection as we plan to invest the remaining Fund III dollars through 2019 and early 2020 (investment period ends in March 2020).
Fund Updates
Fund II completed the disposition of One Agave Center at the tail end of 2018 and formally closed in first two weeks of 2019. As mentioned in Q2-2018 report, we had planned to hold and renew a large tenant at One Agave, but shortly after the previous Purchaser did not perform we received another qualified offer at a slightly higher purchase price. The new Purchaser performed, was in non-refundable escrow as of year-end 2018 and closed in January. Proceeds from this sale were distributed to all partners on February 8th.
With the January distribution of sale proceeds from One Agave, Fund II has now returned 122% of investors contributed capital. That means Fund II investors have received all of their money back plus a 22% profit, AND they still own interests in three assets (Carolina Place, Raleigh NC, Chandler City Center, Chandler, AZ and Commerce Center in Houston).
Fund III officially completed the acquisition of the Zachry Building in November 2018, an 83,000 square 1 foot office building in North Central San Antonio with a relatively high cap rate because the primary tenant will be leaving after three years. Zachry Construction will lease the entire building for three years with plans to move to their new HQ building in downtown San Antonio at the end of the lease term. Fund III also completed in December the closing of the 4th building of The Marketplace @ Lake Boone in Raleigh, NC. Fund III now owns interests in the entire four building mixed use asset. As briefed in our last report, we are now in the process combining the two separate ownerships into one ownership arrangement, after which Fund III will own approximately 35% of the entire project. Fund III also won a build-to-suit development on the east side of Houston along Highway 90 for North West Rubber (NWR). The light manufacturing building, once complete, will total 67,200 square feet and NWR will lease the building for a fifteen year term. Fund III plans to hold the building for approximately three to five years and then sell with at least 10 years remaining lease term.
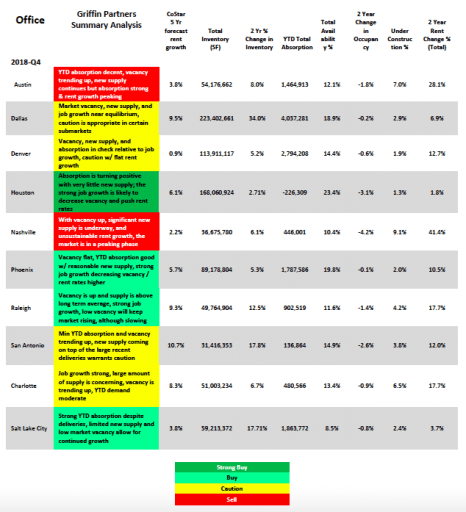
Two quarters ago (Q2-2018) we gave you a glimpse inside our internal analysis for each of our ten target markets and the current market fundamentals each city exhibits. The data we gather comes from various sources including the research teams of large national brokerages, commercial data gathering services to which we subscribe and pay fees for access, government statistics and importantly from our own proprietary database. We use these semi-annual assessments to help guide our strategy and activities for both acquisitions and dispositions.
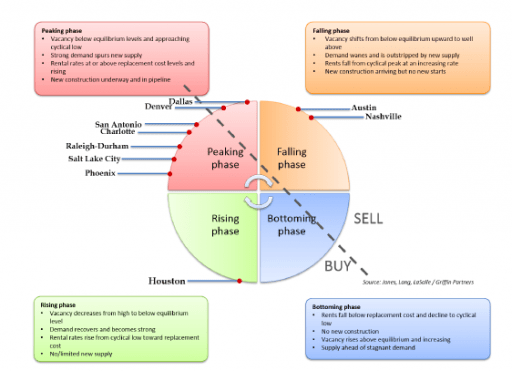
Readers may recall we often point out that various markets are frequently at different stages in the commercial real estate (CRE) cycle as compared to other markets at any given time. The global real estate services firm Jones Lang LaSalle (JLL) illustrates these differences in a graphic called the “property clock,” which illustrates where the conditions in different markets are relative to the standard real estate cycle. Many firms use this standard four phase cycle analysis, with some minor variations between firms. In the case of JLL, the four phases of the cycle are rising, peaking, falling and bottoming. We have borrowed the property clock illustration concept from our friends at JLL, and we use our semi-annual target markets assessment to construct our own property clock. A summary of this data for office and our most recent office property clock is shown below. We do a similar analysis for industrial but since these assessments are a bit repetitive from two quarters ago, we’ve left industrial off this report and will highlight that asset class in one of our future reports.
Here is our current assessment of the ten office markets we target, followed by the property clock on the next page:
Since we’ve taken an instructive look at one of our Fund II underperformers in a prior report, we thought it appropriate to show at least one of our recent Fund II successes. We will also provide some insight of how we continuously learn from our results whether good or bad, in order to make sound investment decisions. We had the good fortune of creating significant value in the purchase, repositioning and sale of One Harrison Park (OHP) in Cary, North Carolina. This investment was a strong success, but it came with some tough decisions on the path to an overall profitable outcome. Fund II realized an equity multiple and IRR from the OHP investment considerably above our underwritten expectations of 1.64x and 17.7%. So, what happened?
OHP was a classic value add story as the building’s prior owner was fatigued and had lost interest in managing the asset from an operational and tenant experience perspective. The asset in turn had fallen off the radar of the leasing community and in turn OHP lost occupancy in the years prior to our purchase. We purchased OHP with two main goals to create value. First, renovate the outdated common areas (including the lobby, all restrooms, elevator modernizations, etc…) to transition the building from a Class B- to Class B+/A- and second, re-stabilize the occupancy (57% at purchase) to its historical occupancy of 95% (2001-2011 historical average). We completed the first objective within 16 months and released the asset with one major tenant by month 18 to move the occupancy above 90%. This all occurred due to the outstanding work of the local property team and the asset management team’s laser focus on completing these two key objectives. With these key objectives complete, we considered a sale and based on our buy-sell analysis made the decision to “sell early” considering the value created. We were fairly
accurate in predicting the potential sale amount compared to our underwriting, albeit 2 years early versus the anticipated 4 year hold period.
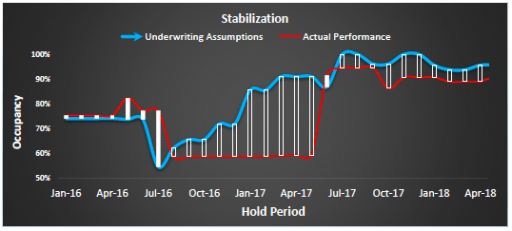
We complete a full cycle analysis for all of assets once they are sold we have a mountain of data as a result. From this we can create some great visuals that help tell the story and the various chapters that occurred along the way. The following table compares our underwriting timeline to release OHP versus actual performance. As you will see, our occupancy fell dramatically (40% of the tenants vacated) in part due to large increases in rents ($4.00psf increase in starting rates) which we anticipated. Although what we didn’t anticipate were two events, overall retention of existing tenants was not the usual 70% renewal probability, actuals were closer to 50% and secondly, the slow pace of releasing efforts over first 18 month period from. The building occupancy flat lined and then popped back up to 90% with one tenant taking 40% of OHP. The overall quality of the tenant base improved as well. The governor or North Carolina actually showed up for a ribbon cutting when the large tenant moved in!
Going forward, judging by the overall strong rental rate growth underwritten due to moving an older building to a new Class B+/A- category, our guidelines on tenant retention will be analyzed more carefully taking into account the historical retention of the existing rent roll as well as the % increase of the rental rates that we project.
Tenant improvement costs in our target markets continue to rise, and this will likely continue due to labor costs and tenant demands for high quality finishes in order to retain and recruit employees. As such, with a view of our existing portfolio of assets,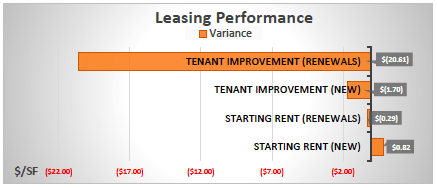 we’ve been able aptly underwrite what “New lease” tenant allowances will cost (within 7% of our underwriting per the chart). In the case of OHP, we were forced to relocate small tenants in order to accommodate a large tenant to take approximately 40% of the building, and the significant moving costs were absorbed in our renewal improvements expenditures causing a big miss. These smaller tenant relocations didn’t allow for any economies of scale nor had we fully considered the complications of moving tenants into, in most instances, slightly different floor plans, and therefore we underestimated the renewal allowances. Our underwritten TI was off by a wide margin due in large part to the relocation costs that we did not anticipate would occur. Our plan was to methodically take the building’s occupancy back to stabilization space by space (2,000sf to 5,000 sf increments) versus stabilizing the asset with one lease (see previous page table). It’s difficult to predict how a releasing effort will perform and the necessary capital amounts that will be incurred. We were able to overcome this underwriting shortfall by accurately predicting that ownership would be compensated for absorbing this out of budget cost through a higher valuation and therefore a strong gain on the sale of the asset. The decision was driven by our final metrics on asset level yield on cost which we reforecast to 9.4% versus our 9.0% originally underwritten yield on cost. The higher yield on cost was achieved and allowed us to capitalize on an even better arbitrage (gain) on the sale of the investment which thankfully played to our favor and generated a handsome return to Fund II investors.
Real Estate Market Conditions
U.S. office market conditions held steady during fourth quarter of 2018. Demand remained positive and was a significant improvement compared to one year ago. Rents have continued to rise per Newmark Frank Research 4Q2018 report, rising 3.3%  since 4Q2017 and vacancy continues its decline, a 40 basis points drop in vacancy despite over 8.0mm square feet of new product delivered. Overall market conditions point to a continued expansion with overall job growth progressing, although likely at a slower pace.
Commercial real estate investment volume continued to rise as of 4Q2018, with an increase of 20.6% year-over-year to $152.4 billion (Per CBRE 4Q2018 U.S. Capital Markets) in the quarter. This figure includes entity level transactions, which were up 14.8% from 2017. Per the chart below, entity level only transactions were up almost 200% year over year since 2017. Excluding entity-evel transactions, which can skew annual comparisons, overall 2018 investment volume remained positive across the spectrum at a healthy 4.9% growth rate per CBRE 4Q2018.
The darling of the 2018 investment sector industrial which lead the pack with Multifamily coming in a very close second. 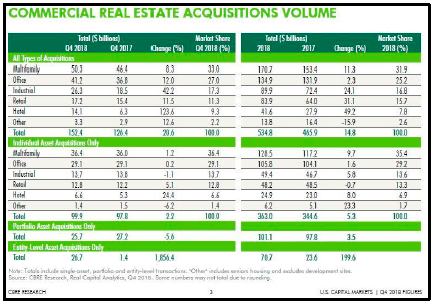 The two asset classes combined for over 57.0% or $305.6 billion of the overall investment volume for 2018. To boot, institutional investors have plowed into the primary markets of Greater New York, Los Angeles and the San Francisco Bay Area attracting 27.7% of all acquisitions across the country in 4Q2018 (per CBRE/Real Capital Analytics). This is nothing new in our opinion and like clockwork “sophisticated” buyers with either private or institutional capital are now getting squeezed out of the primary markets and looking to find better yields in our secondary markets that we target. For example, eight of our ten target markets, excluding San Antonio and Salt Lake City, are in the top 20 overall Office investment as of 4Q2018. What’s not surprising, investors are taking note of Houston’s recent positive absorption, after several years of tenant give-back, and our home city was number 16 for Office investment volume in 2018, the first time its broken the top 20 in several years.
 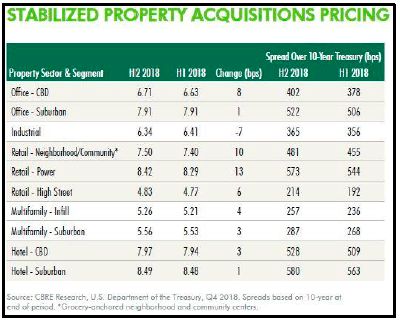 This bodes well for our strong appetite for investing Fund III capital in Houston at relatively low values between late 2016 and early 2018. Institutional buyers are back in Houston with full force looking for opportunities and pricing assets up in an extremely efficient manner. As seen in the CBRE 4Q2018 table for “Stabilized Property Acquisition Pricing” detailing average cap rates across the five property sectors (Office, Industrial, Retail, Multifamily, and Hotel) cap rates have remained fairly stable in the second half of 2018 and modest compression in the past several surveys is now starting to slow. The only sector with cap rate compression was Industrial with 7 bps decrease as of year-end 2018. The continued appetite for finding better yields has forced investor interest into the secondary markets and in particular into the Suburbs. Per the previous table the delta between CBD and Suburban remains tight. For example, Office cap rates between CBD and Suburban assets have increase slightly since 2016 (10 bps in both areas) but the spread between cap rates between the submarket areas (Suburban versus CBD) has held steady at within 120 bps (7.91 versus 6.71). This 120bps spread in cap rates has continued (within 110-120 bps) for over the last 36 months. We believe this gap will stay relatively stable for the foreseeable future.
The continued capital market tightening and the investor appetite to invest in secondary markets, particularly our target markets reminds us to stay disciplined in our investment approach in this stage of the cycle. Evident by the Property Price Index that is completed by Real Capital Analytics as of YE2018 and benchmarked off December 2007 pricing, property values have increased at a healthy pace in 2018, the index was up 6.2% year-over-year and up 29.8% from December 2006 pricing.
With property values up across the board (and surpassing previous peaks) it give us all the more reason for 2019 to be a year of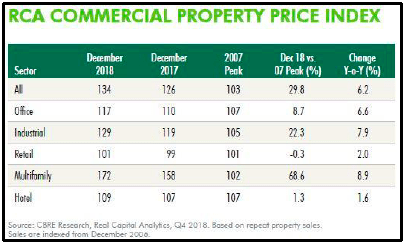 remaining “cautiously optimistic” in our investment approach and final objectives to transact. We will remain focused on the weighted average rollover and tenant or customer credit quality. Per Goldman Sachs Asset Management Private Real Estate team member, Joe Gorin, “the risk of overpaying is growing greater” and “….the best investors will still be rewarded and
those who are a little outside of their expertise could find themselves overpaying”. We’ve seen evidence of both over payment as well as a bid ask spread across our ten markets. Recent experiences in Dallas-Fort Worth, Raleigh, Charlotte we’ve witnessed recent trades eclipse or hit strong Seller expectations and our “base case” underwriting was at least 5% below the best and final round bids, these situations reinforce our discipline and force us to not underwrite “best case” scenarios to win potential transaction. Underwriting the later scenario is dangerous in our view on several levels. Therefore, we remain patient in deploying capital in these instances where we can’t move our underwriting as we have experienced a real bid ask spread in particular trades. For example, offerings that are missing guidance and we’ve decided to not pursue because of high expectations, we stay in contact with the investment sales broker and in various instances we’ve received a call back that there’s a new pricing threshold. Examples of this have mostly recently occurred in Phoenix and Salt Lake City as of late and coincidentally we hope to invest a fair share of our remaining Fund III capital into these specific markets as both areas do not have Fund III capital invested at the moment. Going forward as we see new acquisition opportunities in 2019 within a time of relatively low growth environment, the team will be required to adjust return expectations with slightly lower value- add thresholds and remain disciplined in our approach to “create value” or “the alpha” in any given investment. This approach will help buoy our investment track record as we continue to look for assets that exhibit strong historical occupancy as well as peak to peak rent performance that proves intrinsic demand.
Macro-Econimic Conditions
Where are we? Of late we have spent much time focused on the two largest factors driving intermediate and long-term prospects for the world economy, debt and demographics. The trends for both have not been favorable for some time, but despite the headwinds the world’s major economies can have periods of healthy growth. The US experienced such a period from late 2016 through the better part of 2018. However, in the middle of 2018 some of the big ticket, rate sensitive parts of the economy like autos and housing began to retreat. In the fourth quarter, investors took note of these domestic signs of slower growth as well as clear indications of slowing global growth. Equity markets swooned and longer-term interest rates fell considerably from their recent peaks. As we noted in last quarter’s commentary, inflation also began to decline, with headline US CPI falling from a peak 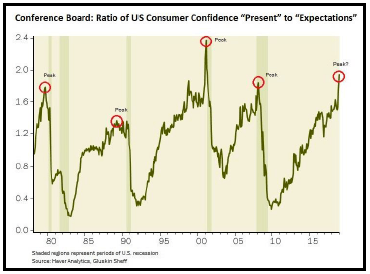 of 2.9% (year over year) in July all the way to 1.6% in January 2019. Such a significant decline in the rate of inflation is unusual for a late cycle economy exhibiting coincident indicators of strong growth and was an early clue that economic growth rates would be decelerating, perhaps more markedly than most forecasters anticipated. We are now seeing the clear evidence of that deceleration in economic output. Because of the government shutdown, we are still waiting on the Q4 GDP numbers. They should be interesting.
In addition to autos and housing, signs of a tapped-out consumer include a widening gap between consumers’ confidence about their current conditions compared to their expectations about future conditions as measured by the Conference Board. The nearby chart shows the ratio of present to expected conditions. The higher the ratio, the more consumers feel better about their current conditions than they do about future prospects. Peaks in the ratio have historically either coincided with the onset of recession or occurred a few months in advance. One could conclude that future spending is not likely to keep pace with current spending.
Unemployment also began to tick up towards the end of last year. We have previously highlighted in our critique of the Phillips Curve the relatively low labor force participation rate in the US compared to previous cycles. Part of the reason for recent modest increases in the unemployment rate can be traced to increases in the labor force participation rate, which is undoubtedly a good thing. Regardless, unemployment rate has nudged up, and it may not need to go up much for the US to enter a recession. It is the change in direction, not the relative level of unemployment that is important. David Rosenberg of Gluskin Sheff astutely points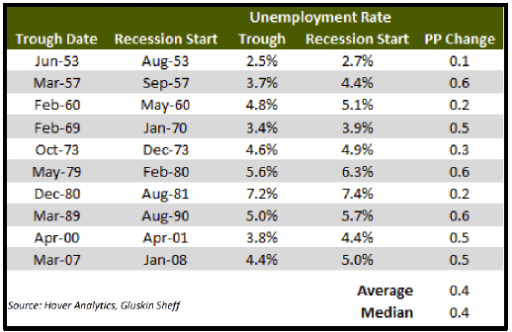 out that unemployment need not tick up much, just 0.4% to 0.6% from the low point, for the US to move into a recession. As of January, it is already up 0.3%. So even though unemployment is generally considered at best a coincident indicator, and usually a lagging indicator, it could be the most important signal of the recession arrival. The data table nearby sets out Rosenberg’s statistical evidence from past recessions, and illustrates that both the average and median change in unemployment has been a meager 0.4%.
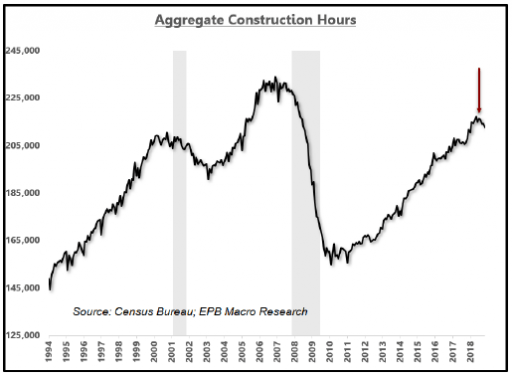
Some good news for CRE investors trying to get something built, but maybe a bit more ominous sign for the economy is the change in aggregate hours worked in the US construction sector, which appears to have recently peaked. The measure takes the total number of employees times the average workweek length in the construction sector to produce a total number of hours being worked in construction. Construction has been one of the more robust components of the monthly payroll growth reports during the accelerated expansion of the last two years. Consistently less total hours needed in construction would presumably be an indication of a slowdown in activity. The next graph shows a pattern that looks like a classic “top” forming with the employment market in the construction sector starting to roll over. While two or three months cannot be definitively declared a trend, this metric is worth monitoring as we move further into 2019.
 In our Q3-2018 report we spilled some (electronic) ink on commodity prices with a thesis suggesting the rise in inflation visible in early 2018 may have been largely attributable to a typical late cycle commodity price surge that was faltering as of the third quarter of 2018 with oil prices finally following industrial metals down in a very evident pattern of declining prices likely to lead to a further deceleration in overall global inflation. The price trends of industrial metals are one of the better gauges of the near-term future track of global growth, especially growth in China, which has an outsized share of global growth. Two charts we put out last quarter showed a clear downward trend in commodity prices from a top in early 2018, with oil prices decoupled and remaining relatively high until later in 2018 when oil prices also began to decline and converge with the rest of the commodity basket. Well……we would be remiss if we did not update that analysis with what just MIGHT be a bit of good news. Copper is the favorite industrial metal of many forecasters because of its pervasive use in many manufactured products and constructed structures, giving is a somewhat distinctive ability to identify global growth trends early. Copper prices demonstrated a path similar to the whole commodity basket (ex. oil), rising as the global economy accelerated from 2016 through late 2017 and then peaking in early 2018 before weakening considerably as global growth began to taper off.
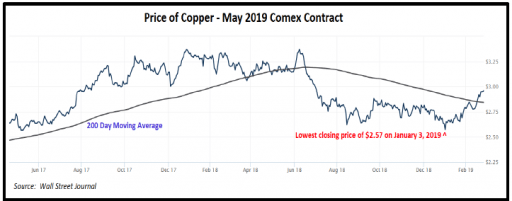 Recently however, as the next chart illustrates, the trend has reversed, and copper prices have moved back up strongly, crossing their 200-day moving average off of a trough on January 3rd. It is likely that this trend is being driven largely by increased activity in China as the Chinese government has undertaken another stimulus program which we will discuss briefly below. Regardless of the causes for this positive price trend reversal in the price of copper, if sustained it is good news with respect to near term global growth. But will it be enough to counter the gathering headwinds, some of which are approaching gale force.
One of the points on the compass with a gale force breeze is Europe. European growth is slowing markedly, perhaps reaching stall speed. 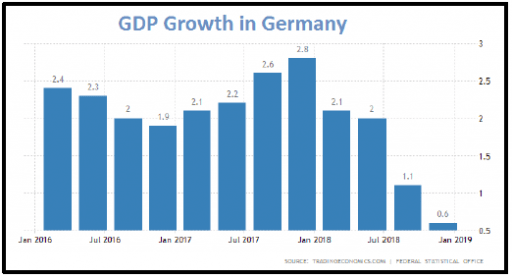 By most measures, Germany is the strongest economy in Europe and has been the primary engine of growth for the Euro Zone. The German economy has clearly run into significan forces working against growth. As the nearby chart illustrates, has dramatically declined from a peak of 2.8% in early 2018 to only 0.6% year over year in Q4 of 2018. The
International Monetary Fund is also losing confidence, lowering its 2019 Euro Zone growth estimate from 1.9% last fall to 1.6% now. The Euro Zone PMI (Purchasing Managers’ Index) data for both manufacturing and service sectors began breaking down a year ago and the trend is continuing with the manufacturing component actually registering its first reading below 50, the point of contraction versus 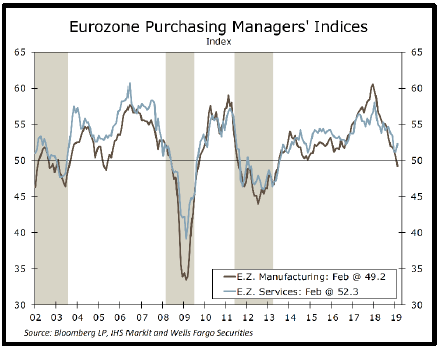 growth, since the last recession. The HIS Markit Flash Euro Area Composite PMI, which combines manufacturing and service sector data, fell to 50.7 for January, following a reading of 51.7 in December. Italy is now technically in recession, and the Italian 10 year bond rates are the only major EU country with rates higher than the US, which is first and foremost a default premium given the excessive amount of debt in Italy coupled with the absence of growth. In a clear sign of investor discomfort, Italy’s largest bank UniCredit priced a new $3bn bond in November at about 4.2% over the euro swap rate, a rather large credit spread. Hopefully the uncertainty of Brexit will be resolved by this summer, and it appears increasingly likely that some form of negotiated Brexit will occur. It should be noted that a hard Brexit (no deal) is not as potentially “unstructured” as the press seems to fear since the standard WTO rules would kick in. Taken as a whole, Euro Zone growth
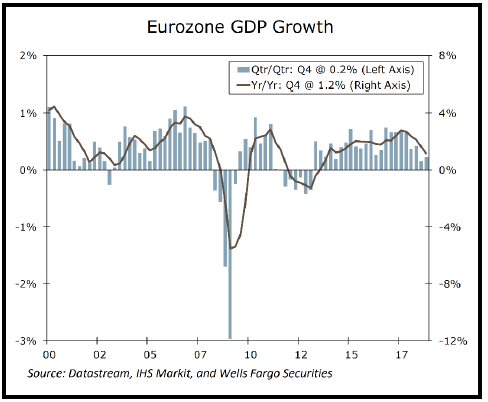 in Q4 fell to 0.2% quarter to quarter and 1.2% year over year. As the next chart shows, those figures further amplify a clear trend of slowing growth bordering on contraction for the bloc.
China – As stated above, while accounting for approximately 19% of world GDP (adjusted for purchasing power parity), China represents an outsized proportion of world GDP growth at roughly 28%, meaning that changes in the growth rate in China can have a significant impact on global growth. Corresponding with the other major world economies, growth in China slowed near the end of 2018.
The official Chinese PMI survey for December slumped below the boom-bust line to 49.4. New export orders slid to 46.6, a level last seen in the depths of the Chinese currency panic of 2015. Property values in Hong Kong, a blunt but usually accurate barometer of conditions and sentiment in China, dropped by 3.5% in November, the sharpest month over 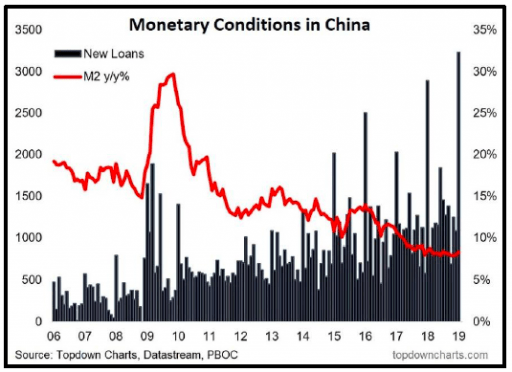 month decline since the 2008-2009 Global Financial Crisis (GFC). A professor at Southwestern University of Finance and Economics in Chengdu, Gan Li, has estimated that one in five apartments in Chinese cities are not occupied. The comparable figure for the US is one in sixteen. Auto sales in China have been down roughly 15% year over year for the past several months.
Similar to the US, the 10-year government bond yield in China is nearing the 3% level, down from 4% in late 2017. In the last 15 years, outside of the GFC, the 10-year yield in China has only fallen below 3% one time, which was in 2016 as a result of rapidly slowing economic conditions and a quasi-global recession. At that time China launched one of the largest stimulus measures the world had seen since the GFC which jump started what many have called the “globally synchronized recovery” lasting through the end of 2017 and sending the 10-year Chinese government bond yield north of 4%. Looking at the chart above which portrays two important metrics in financial conditions in China, it appears that the Chinese government has implemented another parallel stimulus program. The dark bars represent new loan originations in China, and it appears that January set a new record for new loans which posted a gigantic 3 trillion yuan print. This massive amount of new loans succeeded in reversing the downward trend of decelerating monetary (M2) growth (red line). It is normal to see loan growth in China spike in January as annual loan allocations get approved, but the size of the spike this year seem to indicate authorities have abandoned their goal of deleveraging and are resuming a proven stimulus tool of pumping our more debt to prop up the economy. One problem, as we have highlighted in the past, each unit of debt is producing progressively fewer units of economic output.
What are the risks? Speaking of debt, our readers are likely tired of the constant harangues about the risks associated with extreme levels of debt. One of the predictable consequences of ever rising debt levels is the propensity to become “trapped” in the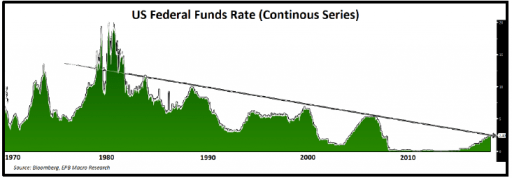 low growth low interest rate box, where Japan has been for the better part of two decades. Evidence that the US may be stepping into such a trap can be found in a historical view of the Fed Funds rate. See nearby chart. In each successive cycle, the Fed is forced to stop raising rates at a lower terminal rate because an economy with increasing levels of debt starts to experience economic stress and relatively tight monetary conditions at successively lower rates of interest.
We covered the risk in the BBB (lowest investment grade) corporate bond market last quarter, so we won’t repeat ourselves here, 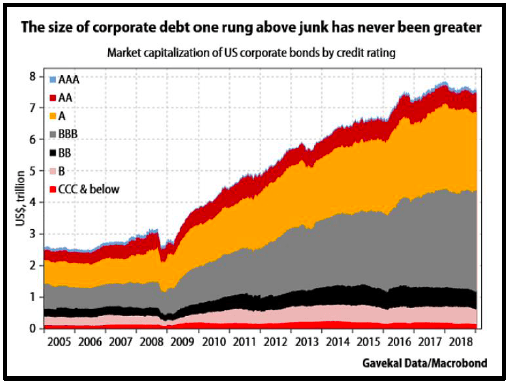 but we are a sucker for cool charts, so we have to include the nearby graphic showing the growth in corporate debt over the last cycle and how much of it is in the barely investment grade BBB segment.
There is another market where bubble like conditions can be found, the leveraged loan market, an important funding source for lower quality issuers. This market has been exploding, with a record $788 billion of leveraged loans issued globally in 2017, and almost the same velocity of issuance in 2018. Approximately 80% of the 2018 originations were brought to market as “covenant-lite”, meaning the borrowers have very few rules they must follow and are more likely to run into problems as a result. Only 30% of leverage loans issued in 2007 on the eve of the GFC were covenant light. Investors who piled into leveraged loan funds because the floating interest rates made them more attractive in a rising rate environment than fixed income debt instruments are scurrying for the exits in an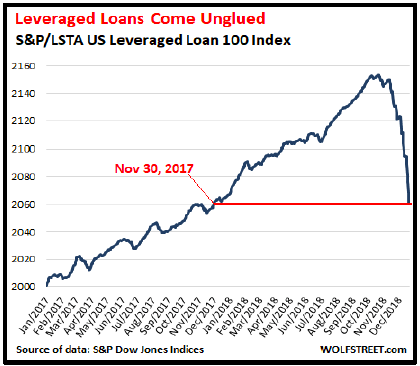 attempt to get first mover advantage. In December, investors pulled a record $3.3 billion out of U.S. loan funds in one week. Values in these funds are plummeting as the next chart shows, reflecting increasing default risk bein priced into the trade. Liquidity in this market is drying up. Junk bond fund outflows also set a record in 2018. We believe an unwinding of the corporate debt market will be a major contributing factor to the next recession. But don’t take our word for it – in its first-ever Financial Stability Report issued in December, the Fed specifically identified business debts as the potential source of the next financial crisis, with leveraged loans being explicitly cited as one of the major risks in that group.
What Does it Mean?
So are we in a recession. Not yet, but sooner than some may think. Last quarter we highlighted a study by the San Francisco Fed which determined the most prescient spread on the yield curve for 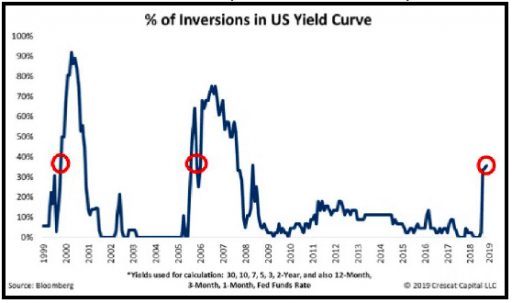 predicting imminent recession was the spread between the 10-year bond and the 3mo T-bill. The study revealed that the curve did not need to invert at those points, but merely fall below 40 basis points (bps). At the time we wrote the spread was 65 bps. Since then the Fed raise the funds rate by 25 bps, and the 10- year rate fell. The spread has recently been fluctuating between 21 bps and 25bps, well below the 40 bps threshold. We also came across a chart shown nearby which tracks the proportion of the yield curve which is inverted over time. Notice that the reading has not been this high, roughly 40%, since just before the GFC. The ruminations along the yield curve, taken together with the signs of slowing set forth above, have led us to conclude that the next recession is likely now a 2019 event.
Regardless of when it occurs, what kind of recession is the more interesting question. Many fear another major recession, perhaps because the last one tends to be front of mind, and it was a doozy. However, our general opinion is that the next one will be relatively mild. Beyond the corporate debt problem, it is hard to see many excesses that need to be wrung out, and the corporate debt problem should not have an outsized effect on consumers. Banks are well capitalized, although they do have exposure to the leveraged loan market as they are usually the “leverage” in leveraged loans. Asset prices could certainly reset, but probably not as much as the declines in 2008 and 2009. However, there appears to be little correlation between the severity of economic contraction in a recession and the severity of asset price declines, so it is anyone’s guess how much asset prices will reset. We don’t anticipate CAP rates to move much because we think rates will be “lower for longer.”
BTW – While it was admittedly our second at bat, it is appearing more and more likely that our call of a 3.25% peak on the 10-year treasury, a number it hit in the middle of last year on an intraday basis but never closed there, was pretty much spot on. We are still negotiating with our counterparty whether our wager was defined by intraday or closing prices!