After months of anticipation we finally witnessed the exuberance of the private capital markets and an extraordinary “tech” salesman collide with a more skeptical public market and result in one of the largest IPO flops ever, WeWork. Our team has been wary of the story and ultra-rapid growth of WeWork for a couple of years, openly expressing our caution and avoiding transacting with the firm. The co-working market leader was veiling large losses by portraying an old business model of sub-leasing office suites as a new “tech company” with the appealing name of co-working. One of the world’s largest venture funds and one very 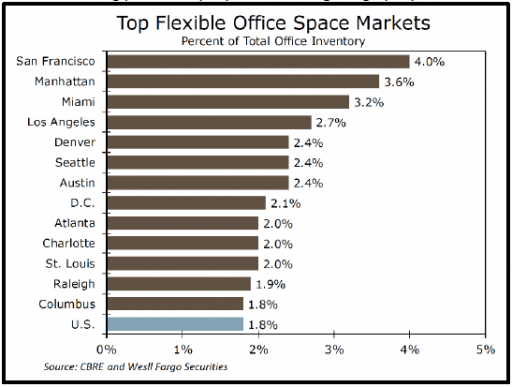 large bank bought in…big time! The overall operating model of co-working is a sound business, if operated efficiently and grown appropriately for the demand. Its clear building owners and office tenants like the option of having a co-working space as part an office building’s overall offering and amenity set. Many of the co-working spaces started over the past several years are full and likely profitable on an individual location basis. A restructuring of the industry is likely on the way, and a reset for WeWork itself is already in play. For co-working locations that are not performing profitably, our sense is a few savvy investors will jump back in at some point and buy the “over-improved” spaces and right size the space to fit the demand as lease defaults rise. WeWork is now operating within all our target markets, and we will keep a close eye on how the situation evolves. It will be an interesting exercise to track the market clearing prices for properties having a high proportion of co-working in their rent roll. There could be some interesting opportunities if valuations for these assets over- correct. Our first chart this quarter shows the markets with the highest concentration of co-working (flexible) office space. Four of our target markets appear on the list.
Many existing and prospective partners have asked us about the impact of the trend towards higher density in office occupancy, of which co-working is one element, and whether that trend fundamentally disrupts office occupancy and the long-term value of office assets. We plan to explore that in depth for next quarter’s report. For the moment, suffice it to say that reports of the death of office as an asset class are premature. Stay tuned for the details.
As anticipated in the Fund III activity summary in the Q1-2019 report, we officially closed two new assets late this summer and as a result entered two new markets with the purchase of a portfolio called Airport 3 in Charlotte, North Carolina and Union Woods, an office building in Salt Lake City, Utah. Fund III is now diversified across six of our ten target markets: Charlotte, Denver, Houston, Raleigh, Salt Lake City and San Antonio. As the holidays arrive, we’ve continued to press forward and have four potential acquisitions under various degrees of control for Fund III investors. One will close in early December and hopefully three more in Q1-2020. Further, Fund II recently sold our ninth of eleven investments, Chandler City Center in Phoenix, AZ. Also, Fund III is in escrow to sell its first investment made in Denver, CO. More details on those activities below.
We’ve had a very busy year and as in the past, we will report the year-end total next quarter, but as it stands, we are on pace to have reviewed over 425 investment opportunities, 20% more than last year, and we will have advanced to the final bid round for marketed deals or letter of intent negotiation for off- market deals significantly more often than last year.
Fund Updates
Fund II: Chandler City Center (suburban Phoenix) was marketed for sale last year, and the offers received did not meet our objective to maximize value. A debt refinancing was completed, and we were completing the remaining elements of the business plan to finish stabilizing the asset when an unsolicited offer from an institutional buyer was received. After some negotiation, the ultimate offer exceeded our expectations and was accepted. A sale of Chandler City Center was completed as of October 2019. The result was a compelling gain for Fund II investors. We originally projected a four-year hold and almost hit the mark, just two months shy with a 46 month hold period and a realized equity multiple of 1.9x. Fund II realized an 18% IRR and the Property made distributions of operating cash flows that averaged 3.3% in cash yield over the term of the hold. This was a nice win for Fund II in Phoenix. Taking into account this sale, Fund II has now returned 133% of investors’ contributed capital. The total of all distributions to date has been $30.5 million, and Fund II investors have received all of their money back plus a 33% profit within three years and ten months of making the final capital contribution. Fund II continues to own interests in two assets with a fair market value of approximately $4 million as of September 30, 2019. For more details on current activities of the remaining two Fund II assets, please look to the Managers Letter later in this report.
Fund III: Q3-2019 has been active, and Fund III will close another new investment in early December after completing due diligence. The Fund will be acquiring Saturn One, in Nassau Bay, TX (Southeast Houston), a 102,000 square foot (SF) office building which is 100% leased and was originally developed by Griffin Partners in 2011 within the Nassau Bay Town Square mixed-use development. This Class A+ asset has a weighted average lease term (WALT) of 4.1 years, a high proportion of credit tenancy, and track record of 100% tenant retention (all existing tenants have remained since completion). The property has a diverse and secure rent roll projected to provide an average cash yield of 10%. Approximately 40.0% of the total expected investment return will come from cash flow. So, how is this a value-add investment? Considering the strong historical occupancy and impeccable tenant retention, there should be room to push net rents meaningfully higher over the hold period. Most importantly, a creative ownership structure will be used. The Property will be acquired in a two-entity tenant-in-common structure alongside an investor with whom both Fund II and Fund III have partnered in previous deals. The structure is effectively an upfront promote, wherein Fund III will receive a fee at closing, retained in whole by the Fund (as you know we don’t charge any acquisition fees!), which reduces the Fund’s investment basis without diluting equity (percentage) ownership. The resulting levered returns are projected to exceed our required threshold.
As referenced above we have three more assets under various stages of control. The next two assets are also located here in the Houston MSA. The first is an urban in-fill mixed-use office and retail asset totaling 137,000 square feet which is currently 81% leased. The opportunity to acquire this property was awarded to another buyer after a formal sales process. The buyer failed to perform on the purchase contract, and through relationships with both the sales broker and the seller, we were able to take advantage of the failed process and get control of the asset through a purchase contract. The investment represents a strong value-add opportunity to fill existing vacancies and stabilize the rent roll. In-place leases have a WALT of 4.5 years anchoring strong projected total returns and a healthy cash yield above 8.5%. This purchase includes a 0.73 acre adjacent land parcel on the hard corner of an excellent intersection which currently houses an abandoned multi-lane drive through banking facility. The excess land is ideal for future vertical ground up development as well as an immediate low-cost redevelopment into an amenity for the existing office building and allowing for some additional ground level retail.
The second investment, also in Houston, is a two-story office building totaling 131,000 SF, currently 55% leased in an excellent location inside a well-established business park in northwest Houston. This high- quality property has been institutionally owned and maintained and has significant value-add potential through the lease up of the remaining 45% vacancy. Strong recent leasing momentum has resulted in 58,000 SF of leases signed in the last 12 months. The property has excellent major freeway visibility, efficient floorplates, and a high parking ratio of 5.0/1,000 SF with excess land providing the ability to expand parking even further. A renovated lobby and tenant lounge have contributed to the recent leasing success. The current owner acquired the property in 2002 and has recently invested approximately $2.0 million replacing building operating systems and the lobby upgrades but is selling now because the portfolio investment vehicle in which the property is held must be liquidated. If completed, this investment will be the last Fund III office investment in Houston. Our team, the Fund III Investment Committee and the Griffin Partners Investment Management Advisory Committee continue to monitor capital allocations to ensure appropriate geographic diversification and avoid overexposure to any particular market, including Houston.
Lastly, on the acquisition front, we have another Charlotte opportunity under control, Airport 7, a 434,000 SF, seven (7) building portfolio that includes four (4) office buildings and three (3) single story office-flex assets. Currently 75% leased with WALT of 3.8 years, these properties provide a very high teen leveraged return coupled with an average cash yield of 9.0% over a projected five-year investment period. Our current macro investment thesis focuses on either long WALT or low basis. This Charlotte opportunity would be a low basis play requiring reimagined leasing and an operations overhaul, various capital upgrades to reposition the assets for a “wholesale to retail” exit strategy (selling off assets individually at a “retail” premium).
As mentioned in the Q2-2019 report, we are officially in escrow to sell our first Fund III investment made in May 2016, Arapahoe Business Park and 345 Inverness in Denver, CO, via the CBRE Denver investment sales team. More to follow next quarter if all goes as planned with closing that transaction.
Real Estate Market Conditions
Capital Markets: The overall office and industrial markets remain in a relatively good position even for this late point in the cycle. Supported by the underlying fundamentals (details below), commercial real estate (CRE) across the nation continues to perform well coupled with the national economy in a long expansion. Real estate investors continue to place large sums of capital into the space. According to Preqin, overall liquidity in Q3 remained strong as investors continued committing capital towards CRE. Evidence of the trend included “Blackstone [raising] the largest ever closed-end private real estate fund in Q3”. Capital momentum continues to favor industrial assets the most, followed by multi-family, then office, with retail bringing up the rear. As our investor clients know, we generally try to stay in front of capital flows, not chase them. As one investment class falls out of favor, often others will rise. We try to remain focused on areas supported by continued demand, buildings that can or will stay full. Capital momentum occurs not only between property types (industrial, office, etc.) but also between risk profiles. At this point in the cycle, institutional investors are “moving their capital allocations to more lower-risk strategies with core and core-plus funds already outpacing full-year 2018 fundraising” (Preqin). Taken as a whole, our strategy has been similar for multiple quarters now. Fund III’s investments should provide those lower risk returns through cash flow now and lining up for exits likely in the next cycle.
Fundamentals: We reported last quarter on the state of our target markets overall job growth over the last 10 years and why they should continue to outperform as drivers of demand for CRE. This quarter we will highlight the overall CRE macro fundamentals from a national perspective. A keen eye on employment rates and CRE data in our specific markets is important, but so is a view on national conditions, both of which help us steer our investment strategy as we deploy capital.
The U.S. office market continued to see methodical growth as of Q3-2019. Net absorption for Q3 of 14 million SF decelerated slightly compared to this time last year although YTD absorption for 2019 is ahead of 2018. Vacancy declined 10 basis points for the quarter and 40 basis points over the last 12 months to stand at a healthy 12.1%, slightly below the peak of the last cycle. Approximately 9 million SF of new product (completions) was delivered during Q3, below any quarter over the past three years.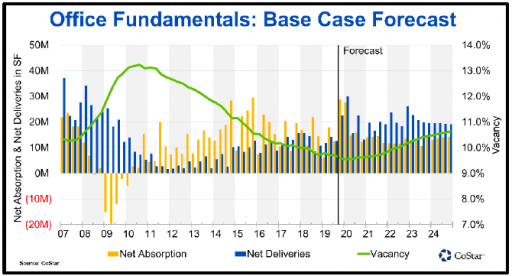 (CBRE & Newmark Knight Frank). These stats are strong, but the rate of change signals that the fundamentals are likely running out of gas. In conjunction with the expected gradual slowing of the economy over the next 12-24 months, CBRE is forecasting office vacancy to increase to 12.5%, mostly as a result of record-setting supply volume scheduled for delivery in 2020. CoStar is also projecting a rise in vacancy, as can be seen in the nearby chart. The low vacancy drove a healthy rise in office rents of 4.1% year-over-year through Q3, which was the fastest pace since 2016 (CBRE). As vacancy rises and employment growth moderates, CBRE projects office rent growth to slow from an average annual rate of 4.0% in 2019 to 3.0% in 2020 and then turn slightly negative in 2021. CoStar forecasts office rent growth to decelerate to around 1% from 2022 through 2024 but not turn negative.
The U.S. office stats are downright boring compared to industrial. Industrial completions rose an astounding 24% quarter-over-quarter in Q3 to 61.6 million SF, and net absorption rose 21% for the same period to 46.3 million SF (CBRE). Note that industrial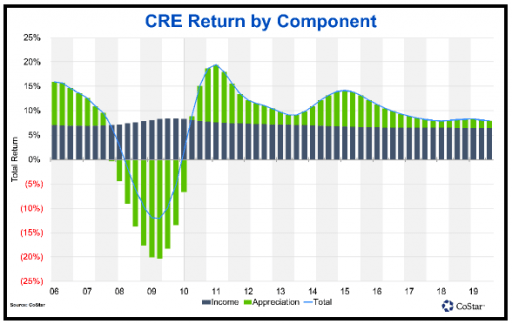 completions for the quarter were higher than net absorption, and as can be seen in the chart on the next page, those circumstances confirm a now two-quarter trend that is a first for this cycle. Industrial absorption had been well ahead of completions for most of this cycle until Q3 2017, and generally balanced since then. However, the most recent two quarters have seen absorption drop below completions, which has resulted in a slight rise in the vacancy rate, to 7.2% as of Q3. Not surprisingly, rent growth, while still healthy, has slowly decelerated. Rents increased to $6.72 in Q3 2019 for a 3.7% year-over-year increase, down from last quarter’s growth of 4.1% (CBRE).
CBRE Econometric Advisors is forecasting a modest rise for industrial rents in 2020 of 3.6%, which would be down from 4.0% in 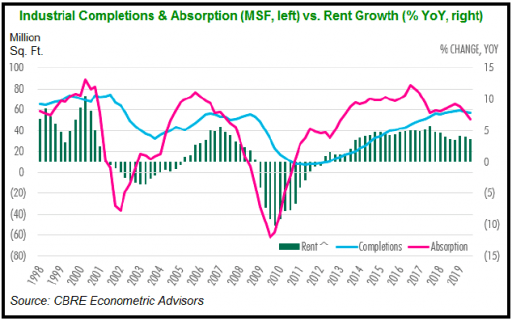 both 2018 and 2019. CBRE: “With demand remaining high and recent deliveries providing more available space options, strong gains in net absorption should continue into 2020—though at a slower pace than completions, leading to higher vacancy over the next few years.”
Remember, these are broad, national fundamentals across all markets and classes of property quality. Specific market fundamentals vary greatly. For the most recently published observations about our specific target markets, look at the Q4-2018 report. Our mid-year 2019 target market review was not externally published but does not vary greatly from the 2018 year-end assessment. CBRE shows national office market rents turning negative (declining), CoStar does not.
The national jobs picture is of course a major factor in the long running positive performance of the office sector over the last decade. Like the stock market, the long expansion, rising values and decelerating rent growth is causing a rising number of CRE market participants to call for caution. Our current macro thesis of low basis or long WALT is an expression of our caution. It is interesting however that real estate investment capital flows aren’t slowing down in light of the rising tide of caution. Investors are simply adjusting their return expectations downward across the spectrum. The steady flow of capital can be partially attributed to foreign capital pushing across to the U.S., happy to receive the higher relative returns in the U.S. compared to other global CRE markets. The chart on the previous page illustrates both how total returns have declined from earlier cycle peaks, as well as how the proportion of total returns that comes from cash flow (income) versus value gains (appreciation) has risen considerably as the expansion has matured.
The last CRE chart this quarter is a bit convoluted but helps to visualize an interesting shift in CRE investment patterns that has occurred over the past several years. The graphic depicts what types of investors have been net buyers or net sellers each quarter. 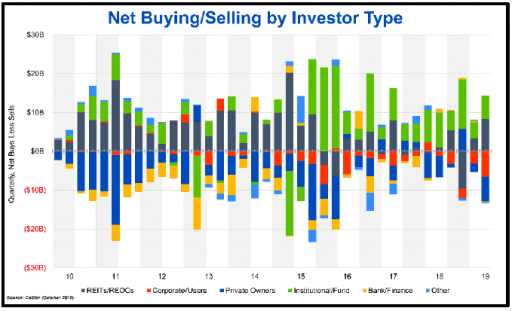 The two most interesting buyer/seller types to observe are Institutional/Fund investors which are light green, and REITs which are dark gray. Early in this cycle, REITs were active net buyers, but with the notable exception of Q2 2019, have been relatively quiet since 2015. Around 2015, as REITs were moving to the sidelines, Institutional/Fund investors moved into a dominant role as net buyers. This is likely another manifestation of broad capital flows as REITs have seen their public shares trade at a discount to net asset values for several years, and Institutional/Fund investors have experienced record capital inflows that must be deployed. Overall, a broad movement of CRE investment capital from public to private markets.
Macro-Economic Conditions
The CRE Market Conditions section above is mostly macro, so we thought it appropriate to go a bit micro on the economic conditions section, focusing briefly on one of Fund III’s target markets. A big element of our investment thesis is to keep a demographic wind in the sails. Many of Fund III’s target markets benefit from economic migration; people and businesses moving from higher cost coastal markets to lower-cost, lower-taxed, more business-friendly geographies. Texas has long been a beneficiary of this trend. North Carolina experiences growth as people and companies move from the Northeast. Our three western markets, Salt Lake City, Denver and Phoenix, benefit significantly from migration of people and jobs out of California. According to the Wall Street Journal, the business consulting firm “Spectrum Location Solutions recently estimated that 660 California companies have moved 765 facilities out of the state since 2017. This includes 10 corporations that have moved their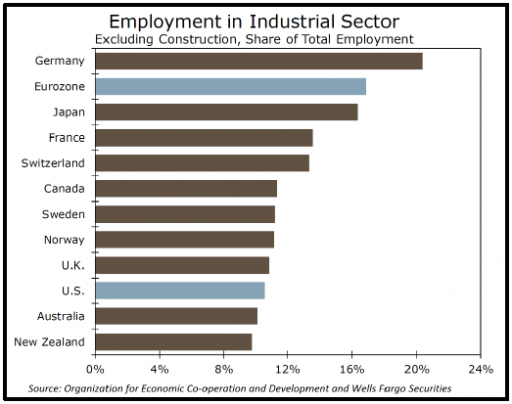 headquarters out of San Francisco.” The most recent and notable example of this trend is the financial services giant, Schwab, moving from San Francisco to Dallas, another target market of ours. Salt Lake City is a great example of a Western market taking advantage of this trend. It is close to the tech-oriented cities of the West Coast. It has a large, rapidly growing workforce, and importantly, lower real estate costs have encouraged expansion. Dubbed the “Silicon Slopes”, Salt Lake City and the surrounding cities in Utah forming the MSA, have a large presence in cloud computing, bioengineering and aerospace. Office rents in Salt Lake City have persistently risen propelled by job growth in tech. The states swelling population and highly educated workforce are attractive assets to employers. In 2018, Utah had the third most rapid population gain, a result of both in-migration as well as a relatively high birth rate.
All of the large global economies, including the U.S., continue to decelerate. Recent data from the Eurozone has been concerning, and while most analysts are avoiding the prediction of an impending recession, the risks of a recession in the EU are mounting. If the EU slowdown turns into a recession, it is likely to be led there by a sharp contraction in the industrial and manufacturing component of the economy. The EU, particularly Germany, have a higher proportion of employment in the industrial sector. The nearby chart illustrates the magnitude with the Eurozone clocking in at just under 20% of employment comprised of industrial/manufacturing, compared to slightly over 10% in the U.S. However, since labor markets in the EU are less flexible than the U.S., the correlation of employment to industrial output is lower, and at present, the contraction in the EU industrial sector at -1.3% year-over-year has yet to reach the threshold of -5% that Wells Fargo estimates is required to have a significant impact on 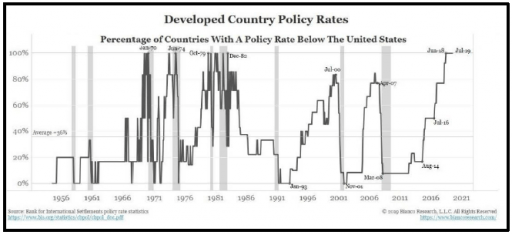 EU employment. Historically, when that threshold is reached, the employment contraction is severe. Perhaps that circumstance is what the European Central Bank is desperately trying to avoid as evidenced by the recent announcement of further monetary stimulus and even more negative “managed” interest rates. We are of the firm belief that the negative interest rate theatrics won’t end well. Perhaps a closer look at the possibilities for the final act of that play in a future report.
$17 trillion worth of debt securities now have negative interest rates. All major central banks now have policy rates below the U.S. Federal Reserve. See nearby chart. The gray bars are U.S. recessions. While not a perfect recession indicator, a quick glance at the chart does not give one a warm feeling about intermediate term economic prospects. On the actually scary side of observations, Greece actually issued a half-billion worth of negative yielding government bonds recently. Yes, that Greece!
Can the U.S. avoid negative interest rates? Hopefully. In large part the answer will depend on inflation. Globally, inflation has been quiescent, especially in the EU and Japan, where it is running on average 100 basis points below the U.S. One interesting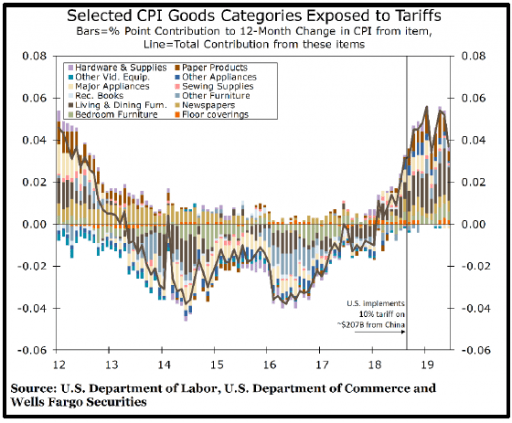 observation, U.S. inflation is finally seeing some influence from the trade wars. U.S. inflation has largely been driven by price increases in the services portion of the economy, while the prices of goods have generally been decreasing. Tariffs have changed that dynamic. The nearby chart gives a great visualization of this change. Labor costs are also rising in the U.S., although still at a measured pace. One analyst that we track thinks there may be a paradigm shift underway in U.S. labor costs. The first chart on the next page shows the compensation of employees share of Gross Value Added (GVA). The calculation of GVA is something we don’t have a complete handle on, but we assume that analysts at Gavekal Data know what it is. We can interpret the chart and it certainly shows the potential of a meaningful change in the cost of labor as a percentage of output in the U.S.
The October jobs report was positive relative to the prior couple of months; however, it served mostly to moderate the pace of deceleration in U.S. economic output. Average monthly 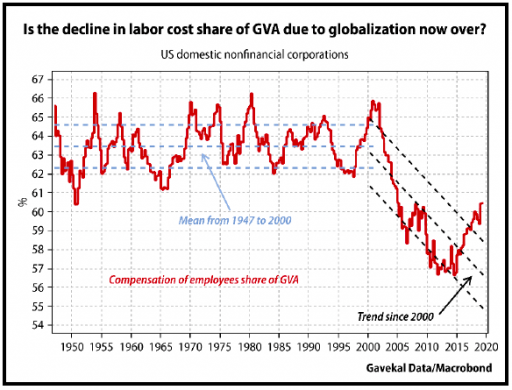 job gains are running at a pace well below 2018, partly because the supply of available workers is lower, but also a result of slowing demand for workers. Manufacturing outside of the auto industry showed improvement in October as well. However, the auto industry is struggling a bit. The GM strike didn’t help. But sales are slowing. The final chart for this quarter is a history of annual sales of the ubiquitous Ford F-150 light truck. Perennially the bestselling truck. The annual rates of sales for the f-150 in 2019 has fallen at the fastest rate since 2009, when the U.S. economy was still in the teeth of the Global Financial Crisis. Admittedly a very narrow indicator, but one that corroborates other signs of decelerating economic activity.
And finally, a possible canary in the coal mine. Actually, there are two. One is the Fed’s new Quantitative Easing (QE), which the Fed will not admit is QE, but it is. More on that next quarter. The second is in China. The devaluation of the Yuan is causing even more stress in China’s banking system. In a relatively closed economy with tight capital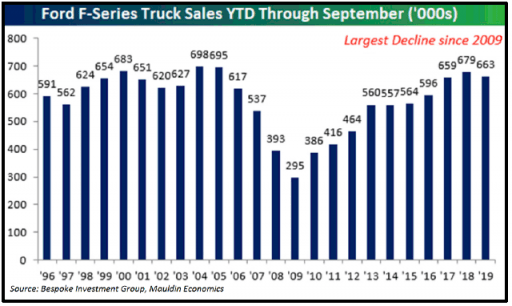 controls, it may not mean much, but China is bailing out some of it’s smaller (only $400 billion!) banks. The analysts at Crescat – say: “it’s a sign that the economy is under severe pressure. Crescat expects “much larger loan losses to soon surface.” And as Crescat reports: “According to Bloomberg, China’s central bank recently concluded its first review into industry risk and 420 firms, all rural financial institutions, were considered “extremely risky” and just two received a top rating. China’s debt levels are overwhelming, and a significant [further] currency devaluation is likely on the way.”