A little more than half of 2021 is in the books, and thankfully things are looking less uncertain compared to this time last year. With the start of school upon us, we hope you’ve had a relaxing summer break including some sense of normalcy, a bit of travel, and the enjoyment of being with family and friends. The summer haze of 2020 is long gone, and we are not short on topics to discuss. There has been a strong resurgence of capital flowing back into the commercial real estate (CRE) market with sales offerings and closed transactions in all major CRE food groups. The impact of the COVID vaccines rollout earlier this year on activity and in particular the return to the office (or not!), coupled with the overall real estate fundamentals trending towards pre-pandemic norms, and the insatiable supply and demand of industrial are all top of mind ..….where do we begin!?
The Table of Contents below will hopefully assist our readers with navigating to a preferred section or getting a quick general take.
REAL ESTATE MARKET CONDITIONS: Pages 1-9. In this section, we will give a brief review of the following:
o Summarize the strong resurgence of real estate capital flows back into the market in the first half of 2021 (Pages 1-2)
o Office Target Market semi-annual “property clocks” and general takeaways on the “return to office” and resumption of office leasing activity (Pages 1-7)
o Industrial Target Market semi-annual “property clocks” and general takeaways across a few select markets (Pages 8-10)
· Macro-Economic Conditions: Pages 10-12. In this section, we will assess our current thoughts on interest rates and the FOMC’s new dot plot (don’t bet the dots).
REAL ESTATE MARKET CONDITIONS
The first half of 2021 is like those drunken sailor days of spending capital in 2007. Really? Yes, really, capital is back. Investors’ appetite for lower risk yield is at record levels, driving cap rates down for industrial, multi-family, medical, and life sciences. Office cap rates are starting to see a recovery with robust bidding pools for both value-add and core assets classes, while retail and hotel have remained constant with limited trade volume since the early stages of the pandemic.
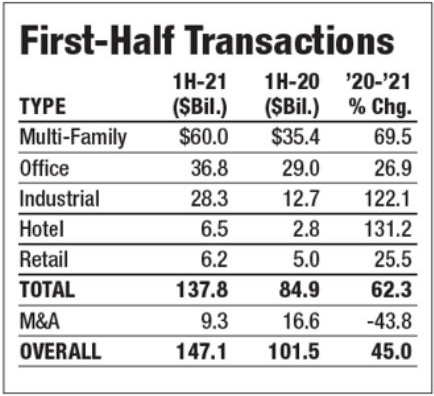
Through two quarters of 2021 “…a total of $137.8 billion of trades across all property sectors made the January through June 2021 the busiest first half since the frenzied days of 2007”, according to the Real Estate Alert Deal Database of sales worth at least $25 million. As highlighted in our last Market Update “…competitive buyer pools have forced investment return expectations down and relatively cheap debt due to artificially depressed interest rates tends to drive asset values higher as well.” This continued underpinning of low-cost capital and optimism that the pandemic will be subsiding has driven CRE investors to pile into the market at a pace similar to the heady times of 2006 and 2007. Additionally, as stated in our last report: “When you couple this massive amount of capital raised alongside the major food groups of real estate that are liquid, the sector has set itself up for continued expansion.” We certainly witnessed in the first half of 2021 a strong expression of this pent-up capital demand converting uninvested capital (dry powder) into acquisitions and developments. While there have been a few instances of distress sales, most transactions include willing sellers at non-distressed prices.

As an example of the elevated appetite, we are observing industrial developers selling (or preselling), at meaningful margins above cost, newly completed industrial assets at shell certificate of occupancy, empty, instead of fully leased and stabilized. Why are large institutional capital sources willing to pay above replacement cost for an unleased building and absorb the leasing risk? Macro-level portfolio allocations to industrial for these investors are creating huge momentum, and while uncertain entitlement time frames prevent them from taking development risk, these investors are confident enough of industrial leasing demand to take on the leasing risk. How long will these premiums last? We don’t know for sure, but there appears to be enough tailwind for agile developers to take the development risk and capture these premiums. We intend to do so with one of Fund III’s investments, and a few of Fund IV’s.
Looking at the sales volumes of the various CRE sector types in 1H21, multi-family and industrial led the charge. Multi-family sales were the leader in the clubhouse, with $60 billion in sales in the first half of 2021, and Industrial sales overall percent increase year-over-year was literally off the chart with a 122% gain in trade volume and a total of $28 billion (up from $12 billion from 1H 2020). Office sales were in second place in terms of gross dollar volume, but a distant third in year-over-year growth, as investors are slow to rush back into office given the uncertainty of future office demand arising from the work-from-home (WFH) trend. We see this uncertainty as opportunity and will touch upon it later in this report.
Clearly, the market has hit the “risk-on” button expressing a voracious appetite for yield. One of the most successful investment sales brokerage houses in the country is Eastdil Secured, which mainly provides sales services for $100 million-plus transactions. Recently, Eastdil’s President, D. Michael Van Konynenburg, stated “…there continues to be a significant amount of capital flowing into real estate and a significant amount of activity in the pipeline”. He went on to say Eastdil is seeing “continued growth in sectors and markets that already are performing well, ….transaction pipeline 30% to 40% ahead of what it was in 2019, …and we will see 2021 be a record year.” We believe this is a testament to CRE as an asset class and its resilience to snap back in a highly volatile marketplace. Further, this is a stamp of approval by market participants to see past the pandemic and provide optimism that markets will recover.
TARGET MARKET CONDITIONS
As part of our modus operandi, we conduct semi-annual market fundamentals analysis within our ten target markets for both Office and Industrial sectors. To remind our readers, we gather data from various sources, including large national brokerages houses, commercial data gathering services to which we subscribe and pay fees for access, government statistics, and importantly from our own proprietary database to which we are constantly adding information about properties. We review this market data and produce an assessment of the current conditions in each of our target office and industrial markets. We are not currently targeting industrial development or acquisition in Austin, Phoenix, or Denver because of the market conditions in those industrial markets and our desire to be more focused with our industrial expertise and resources.
These markets are frequently at different stages in the CRE cycle relative to each other at any given time. We’ve borrowed the Jones Lang LaSalle (JLL) illustration of these differences in a graphic called the “property clock,” which we have mentioned in previous quarterly reports. For those that don’t remember or need a quick refresher on what the property clocks are, they provide a relatively easy way to understand visually where a particular market sits within the real estate cycle. Many firms use this standard four-phase cycle analysis, with some minor variations between firms. The four phases are rising, peaking, falling, and bottoming.
A summary of our analysis, compiled for Office, is set forth in the table on the following page along with a brief comment on our assessment of the current fundamentals as well as a color-coding for a “Strong Buy”, “Buy”, “Caution”, “Sell”.

On the following page is the “Property Clock” detailing where we think each of our ten target Office markets stands within the cycle.

As can be seen in the data table above, all our target office markets have relatively flat demand. This is no surprise because the data lags the activity that has started to occur in the last 90+ days. Absorption is only logged when a tenant occupies space and a lease commences, and there can be a lag between lease negotiation/execution and commencement. Most of the markets are still experiencing reductions in tenants’ space requirements, due to post-pandemic right-sizing, which pushes vacancy higher. Still, leases are getting signed, unlike a year ago when the market was essentially frozen. There is also a trend of occupants moving from older, functionally obsolete office buildings to new product. Austin, Nashville, and Charlotte have the highest percent change in inventory over the last 12 months, hence the rising vacancies in mostly older, obsolete product. Places such as Raleigh and Salt Lake City have seen very little new supply, and overall fundamentals are strong as both have the lowest vacancy across all our ten target metros, at 14.7% and 15.8% vacancy, respectively.
Overall, we are seeing a strong push within our target office markets for folks to get back to the office, either full-time or with hybrid work schedules. During the vaccine rollout in the early part of the year, our suburban assets measured increases in utilization. The “Delta” variant may create a pause for 60 to 90 days, but we expect to see a continued push by companies to return to work, increasing their utilization. The data we have seen indicates a majority of employers across all industry sectors (Tech sector remote/hybrid model aside) clearly want employees back in the office.
Suburban office has held up better than CBD, and our portfolio of assets saw only a small and manageable rise in May/June of 2020 in unpaid rent. Utilization of our office and mixed-use assets has risen from the 30% range in the early stages of the pandemic to now over 65% across the portfolio. Given the suppressed transaction volumes in office, it may be too early to draw concrete conclusions, but suburban office values have generally held up better than CBD. Rightly so as WFH has had a bigger impact on CBD assets across all major primary and secondary markets. Have you been to downtown Houston, Dallas, Charlotte, or Raleigh in the last 6 months, it’s rough. The following table from Cushman & Wakefield’s 2Q21 Spotlight report underscores the movement of tenants from the CBD to suburban submarkets. Essentially vacancy rates flipped for the first time since 2000 from higher in the suburbs to higher in the CBD, and Cushman forecasts that to continue until at least 2025.

We are encouraged by the recent price performance of suburban offices considering eleven (11) of our remaining Fund III assets are suburban or mixed-use office buildings. Real Capital Analytics reports 12-month YoY price gains of 7.7% for suburban office properties vs. -2.4% for urban/CBD as of 2Q21.
Green Street Advisors (2Q21 publication) produced a graphic charting WFH “susceptibility” against population growth across the top 35 U.S. metros. The chart also color codes the markets into three buckets; Sun Belt Markets (Charlotte, Phoenix, Salt Lake, Houston, etc..), Gateway Markets (Boston, New York, LA, etc..), and other Non-Gateway Markets (like Indianapolis, Memphis, or Cleveland, no offense). We show the graphic from Green Street on the next page. It provides an excellent illustration of what we are seeing across our portfolio regarding a continued increase of office use.

Since above-average population growth is one of our market selection criteria, it is unsurprising that all our markets are above the average population growth line. Eight of our ten target markets are in the ideal top left quartile which is “Above Average Population Growth, less susceptible to WFH”. Dallas is on the goal line, and Austin is on the 5-yard line due to its Tech heavy industry which is more resistant to send their employees back to the office. Again, encouraging from our perspective on our continued pursuits to invest in these vibrant office markets.
Another drumbeat data point is the continued uptick of office leasing activity across the US. According to Cushman & Wakefield’s 2Q21 report, the national office vacancy rate is currently 17.2%, although according to Transwestern’s U.S. 2Q21 report, overall office saw positive net absorption of 22.9M RSF, and asking rates are up 1.9% over trailing 12 months. Leasing activity is up across the country as of the first half of 2021, and new leasing activity jumped quarter over quarter by 18% and 7%, respectively, per Cushman & Wakefield 2Q21 report. Will this increased activity be sustainable and correlate to new incremental tenant demand? Only time will tell.

Regarding Industrial, typically each of our target markets are at various stages in the cycle, but the relative outperformance of our target industrial markets across all geographies has made for a boring property clock. All our industrial markets are firing on all cylinders, falling within the rising or peaking phase of the clock. Houston, being the only exception, as it’s in the early innings of a substantial move within the “Rising” phase in the near term. Below is our summary table for Industrial.

The following “Property Clock” details here how each of our Industrial markets stands within the cycle.

The US industrial market continues to perform posting a record forty-four (44) consecutive quarters of positive net absorption alongside a record amount of new supply; while the US vacancy rate remains below 5.0% with impressive rent growth in the last five years per CoStar 2Q21. Our target markets reflect this national trend. We list some highlights below. Please note, the data quoted below reflect July and August activity. The table on the previous page uses a compilation of data from JLL and CoStar as of the end of 2Q21.
Salt Lake City and Nashville are two of the top rent growth markets nationally, with growth of 9.7% and 7.7%, respectively, over the last twelve (12) months (CoStar 2Q21). As you would expect, these two markets also have some of the lowest vacancy rates, with Salt Lake City checking in at 2.9% and Nashville registering 3.6% (CoStar 2Q21). Developers have taken notice of the performance in these markets, but the higher future deliveries will not be enough to dampen rent growth significantly.
DFW is truly a behemoth in the industrial world and currently leads the country with space under construction clocking in at almost forty-five (45) million square feet. But the absorption has kept pace with DFW scoring over thirty-four (34) million square feet of absorption over the past twelve (12) months. This high level of demand has allowed DFW to maintain rent growth of 6.9% over the past twelve (12) months (per CoStar 2Q21).
Houston and Charlotte have some of the lowest amounts of space under construction when evaluated as a percentage of the total industrial inventory. This has resulted in Charlotte posting a very impressive 5.2% rent growth over the last twelve (12) months. Houston, arguably the hardest-hit major US industrial market during the pandemic, has roared back with almost eighteen (18) million square feet of absorption over the last twelve (12) months (per CoStar 2Q21). Houston’s rent growth has really lagged the other larger markets during this period (a paltry 1.8%) but has the most room for improvement as leasing activity will continue to pick up over the back half of 2021.
MACRO-ECONOMIC CONDITIONS
Who Cares?
We do!! For our newer readers, and maybe as a reminder to our long-term readers, we provide some economic commentary each quarter because we want our investors to have a view into what we are thinking about interest rates. The capitalizations of almost all our investments include debt. In every case, conservative amounts of debt with terms as flexible as possible. We must make decisions about whether to employ floating rate debt or fixed-rate debt. Is the fixed-rate premium of sufficient value as to be justified? If we employ floating rate debt, we must determine whether to enter into hedging agreements and if so, what the received value of the hedging agreement might be compared to its cost. To make those decisions and valuation judgments, we must have a constructive opinion about economic conditions and the likely trajectory of interest rates. We share our opinion with you on these pages so you can assess the appropriateness of committing some of your investment capital to our management, and so that you can better understand the level of interest rate risk you are assuming when you invest with us. We may be wrong, or we may be right (more often than not lately, hanging out at the short end of the curve), but at least you will know.
Reading the tea leaves (and data), and listening to the pronouncements of members of the Federal Reserve Open Market Committee (FOMC) lately, it seems apparent some kind of “taper” seems likely before year-end. We think the delta variant will begin to fade by Halloween, and unless Delta has more economic effect than appears likely, the recent run of inflation should finally move the FOMC off its pedal to the mettle stance. The taper will no doubt only gradually reduce the amount of monthly purchase of treasuries and agencies by the Fed. For us older observers of economic analysis, it can be instructive to contemplate how we got to the point of having this new word “taper” in our lexicon……..
Slowing down the rate of the Fed’s asset purchases (“tapering”) and eventually eliminating those purchases is something wholly different than raising interest rates. The two may be correlated, but they are not necessarily linked. Frankly, we don’t know because we have only been in this position once before in the mid-20-teens, and the macro circumstances were different. At that time, we were recovering from the global financial crisis (GFC) with weakened financial institutions, limited fiscal stimulus, and a healthy international trade environment. This time we have very healthy financial institutions struggling to find borrowers, large BLOWOUT amounts of fiscal stimulus with the accompanying massive addition to debt, and a significant retreat from the multi-decade pattern of globalization. Although the retreat from globalization had started prior to the pandemic, it has clearly accelerated and appears irreversible at this point. Those are considerably different conditions, and their interplay, along with numerous other variables, makes forecasting difficult.
Despite the recent move up in the U.S. Leading Economic Index, +0.9% in July, which was better than expectations, the U.S. is, in our opinion, past the peak growth which occurred in the spring, and as such, the growth rate should continue to decline from here. Growth will probably remain above its long-term trend for a few more quarters, certainly a good thing, but should settle into its longer-term trend below 2% sometime in the 2nd half of 2022 at the latest.
the growth rate should continue to decline from here. Growth will probably remain above its long-term trend for a few more quarters, certainly a good thing, but should settle into its longer-term trend below 2% sometime in the 2nd half of 2022 at the latest.
Members of the FOMC recently released their updated dot plot, a graph of their individual expectations for the overnight Fed Funds rate. We show that chart nearby, along with our more subdued expectations for the path of rising short-term interest rates. Setting aside for the moment that the Fed Funds Rate doesn’t even exist in the same form as it did prior to the GFC, because the Fed has effectively destroyed the fractional reserve banking system we enjoyed for a century, the Fed does still control the very short end of the interest rate curve through several tools, and the dot plot is the FOMC members forecast of that overnight rate. These dot plots have a very poor record of accurately forecasting the actual trajectory of interest rates, and we expect this time will be no different. Accordingly, we have overlaid our forecast in red. As you can see, we do expect the Fed to eventually raise the overnight rate after tapering is complete, but in our opinion, it is unlikely we will see much higher short-term rates before growth falls into its longer-term trend below 2%, with inflation also likely at or below 2%. As such, it is unlikely the Fed will set the overnight rate at or above 2%, which would mean real (inflation-adjusted) overnight rates would be greater than 1%. Real overnight rates have almost never been positive for any meaningful amount of time since the GFC.

Even when the taper begins, there is so much excess liquidity in the system that conditions may not change much in the short term. A crude measure of truly excess liquidity in the system, balances outstanding on the Fed’s Overnight Reverse Repo Facility (RRP), is now regularly over $1T. Rates in the overnight market are extremely low, and in some cases, negative due to a lack of collateral supply, exacerbated by the U.S. Govt debt ceiling, which likely won’t be addressed until late in the fall. The treasury has burned its cash balance down from over $1.5T at the height of the pandemic to around $300B, which is a shadow form of QE. That will likely reverse when the debt ceiling gets addressed and be shadow tightening. Equity markets are at all-time highs. Asset prices should continue to get aggressive bids, and asset financing costs will continue to be at multi-generational lows.
Debt, Demographics and Productivity (DDP)
Most of our previous reports have explored the implications of one or more of the three elements of DDP. We are of the firm belief, given the present state of the global economy, that these three things are by far the most important drivers of long-term economic conditions. In our Q4-2020 report, we assessed current trends in the population (demographics) and productivity, both currently in secular declines. Last quarter's report had a discussion of the decline in employment to population ratio, another important demographic parameter less healthy than in previous generations. Almost all our reports reference some description of how excessive debt levels reduce the marginal productivity of debt and lower the velocity of money. We can’t avoid a mention of these issues this quarter because they are at the core of our opinion about the trajectory of interest rates. We will, however, try to be brief.
First the good news. Productivity has improved during the pandemic. While falling slightly in the second quarter, it remains above its recent trend. Probably a bit early to draw conclusions from the recent data, but it is worth noting a recent study of 30,000 employees conducted by IT Mexico, Stanford, The Hoover Institution and the University of Chicago. According to Eastdil, the study asserts “work-from-home could provide for a 2.7% increase to labor productivity (mainly on savings in travel time).” And McKinsey says, “the national economy could see a 1.5% annual nominal increase in productivity growth through 2024, given efficiency savings associated with large-scale adoption of technologies including telemedicine, e-commerce, digitization of sales channels, hybrid work, construction design improvements, and warehouse automation. At the most basic level, the U.S. economy is currently producing 1.4% more GDP than in Q4 2019 with 2.3% fewer workers.” It would take a productivity miracle, a rapid surge from revolutionary technologies and the rapid adoption of those technologies, to get the world’s highly indebted developed economies out of the debt traps they have put themselves in. We should pray for this outcome.

The robust economic research team at Wells Fargo recently did an in-depth piece on the impact of slowing demographics on economic growth. The piece is available to the public and can be found here if you are interested. Wells Fargo confirms points made in our discussion last quarter of the importance of labor force participation. The Wells Fargo report does touch on our concern about the decline of labor force participation, but does not provide any data or address our supposition about the negative impact of government transfer payments raising the level of income dependency and lowering the motivation to work and participate in the labor force.
Wells Fargo: “But as the number of individuals of working age accelerates, the potential of an economy to produce goods and services generally accelerates as well. Conversely, a country's potential economic growth rate generally slows as its working-age population decelerates.”
Wells Fargo continues: “As noted previously, countries with strong growth rates in their working-age populations tend to enjoy stronger rates of economic growth than their demographically challenged counterparts. In short, the amount of goods and services produced tends to rise as the number of workers available to produce those goods and services increases. But the same number of workers can produce more goods and services if their productivity rises. Consequently, an economy's so-called rate of potential GDP growth is essentially equal to the sum of its labor force growth rate and labor productivity growth rate.” See nearby chart.
Wells Fargo concludes: “….the trajectory of the labor force growth rate in the United States does not look conducive to a rapid rate of potential economic growth, at least not in the foreseeable future.”
Alternative Opinions
We know it is important to remain open to ideas which run contrary to our own. Keep on learning!! There are many smart and seasoned people who firmly believe that the risk of more permanent inflation and therefore higher rates is high. A Deutsche Bank piece in June was particularly interesting and concise in making this case. We encourage readers to click on the link above and read the short piece. In summary, it asserts that political pressure to address income inequality, climate change and other social dislocations will influence fiscal and monetary policies in a way which will force excess fiscal spending driving aggregate demand (Keynesian) and central bank balance sheet expansion (ignores declining velocity of money). In our view, it would require a change in the Federal Reserve Act (see our Q3-2020 report) or such tremendous continued reckless fiscal and monetary policy that the dollar becomes at risk for losing its reserve currency status.