Our TEAM continues to turn over many (rolling) stones to find strong investment opportunities in each of our markets, and considering we last referenced our overall search activity in late 2018 now is a good time to provide readers with a snapshot insight into our investment search statistics. This data is a useful tool to improve efficiencies, devise better search strategies, and drive decisions about targeting certain assets. Additionally, the data affords us real time market views to help understand capital market conditions and trends in each of our target markets.
As of mid-year 2019, we have reviewed 260 investment opportunities; a 50%+/- increase from the mid- point in 2018, which totaled 171 potential investments. The increase is primarily the result of three factors. First, Phoenix has witnessed a strong surge 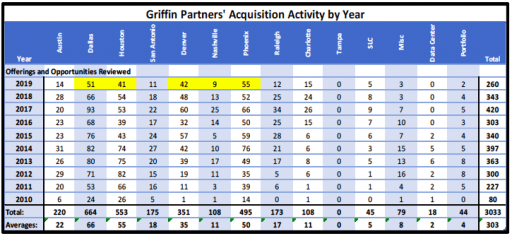 in the number of investment opportunities, and as mentioned in prior reports, we have made a concerted effort to invest Fund III capital into Phoenix. We are close to cracking the code and hope to break through before year-end. Second, the markets we target have seen an overall rise in offerings as 5 of our 10 target markets experienced offering increases greater than 50% compared to last year’s mid-point. Third, greater capital flows moving from the Primary to Secondary markets as mentioned in last quarter’s report contributed to this increase. Owners have recognized the shift, and they are wisely offering more assets for sale. Detail of our activity may be found in the chart above.
We remain highly selective with just over 1 in 100 opportunities surviving all the way through our review process to becoming a completed acquisition. A repetitive theme, we continue to be disciplined with respect to minimum return requirements, maximum leverage (no greater than 65% loan to cost) and the search for peak-to-peak rental rate growth, which means we must roll over many stones in our search for a gem.
Our selection criteria for opportunities have not changed materially since this time last year but the overall volume of assets in five of our ten markets are at or near total deal volume for the year and we are only half-way home. The most active selling markets (highlighted in the chart) include Dallas, Houston, Denver, Nashville, and Phoenix. As projected in prior reports, activity levels have returned to normal for our markets overall, and we are optimistic about the prospect of deploying the remaining Fund III capital prior to Q1-2020.
Fund Updates
Fund II: This quarter there are no substantive updates for Fund II, so please refer to the Manager’s Letter included in this report for any specifics on current activities for the remaining three assets in Fund II.
Fund III: As mentioned in our last report the North West Rubber Ltd. (“NWR”) build-to-suit is in full swing and it remains on time and on budget! See the latest photo from our Development TEAM taken in July.
Loop Central, located in Houston, our largest office investment to date in Fund III, recently approved a key piece of the strategic business plan to redevelop the Project’s amenity package. This includes a new fitness facility with accompanying locker rooms, a  state-of–the-art conference facility, updated café and tenant lounge areas, outdoor seatin, and other tenant facing common areas updates throughout the three-building property. We are excited moving section business forward, and it is anticipated these items will be completed by year-end 2019.
We are selling our first Fund III investment, acquired in May 2016, Arapahoe Business Park and 345 Inverness in Denver, CO, through the CBRE Denver investment sales team. We have already selected a buyer via formal LOI process, and a contract is in negotiation.
Real Estate Market Conditions
As we reported last quarter, institutional capital flows into secondary markets continue at a strong clip, due in large part to the strong pricing metrics in primary markets forcing institutional buyers into secondary markets. Buyers are watching these secondary markets overall outperform expectations in employment growth coupled with rising office demand. Jobs are the best measure of future demand and our markets are leading the charge, so we will examine two important data sets: 1) a good picture of job growth of our targets over the last 10+/- years and 2) why we firmly believe that our markets will continue to perform as drivers of demand for office as well as the other major types of real estate.
Cushman & Wakefield Inc. (C&W) recently published a piece entitled “Spotlight on U.S. Employment: A Tale of the 35 MSAs” in June 2019, highlighting employment gains across 35 MSAs (Metropolitan Statistical Areas) in the U.S. The takeaways offer an excellent backdrop as why we continue to uphold conviction about our target markets due to their past performance. This report broke down the MSAs into four groups: All-Stars, Overachievers, Middle of the Road, and Late Bloomers. This breakdown was specifically tied to the number of jobs added between 2009 and 2018, in essence, “the job engines of the U.S. in the current expansion”.
To cut to the chase, eight of our ten target markets landed in the “All-Star” and “Overachievers” bucket, and Raleigh and Salt Lake City fell into the “Middle of the Road” bucket, just missing the Overachievers designation by a few factors. The table herein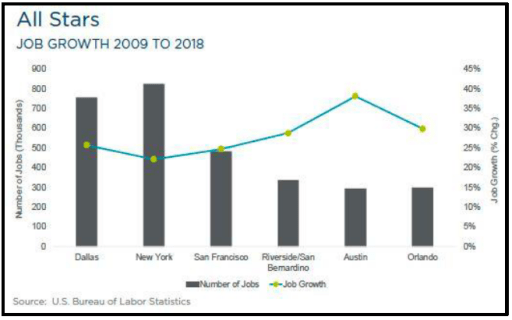 summarizes the top U.S. markets “All-Stars” over the last decade that have outpaced the rest of the country in job gains. Dallas and Austin are clearly the leaders for our markets and these metros ranked 2nd and 3rd, losing only to San
Francisco in terms of overall % change rent growth (92.6% growth for San Francisco) from 2009 to 2018, 40.5% and 29.8% asking rents % change for Austin and Dallas, respectively.
The lion’s share of our markets (six of the ten) had an impressive showing in job gains in the last decade due to two factors: 1) the strength of the technology sector 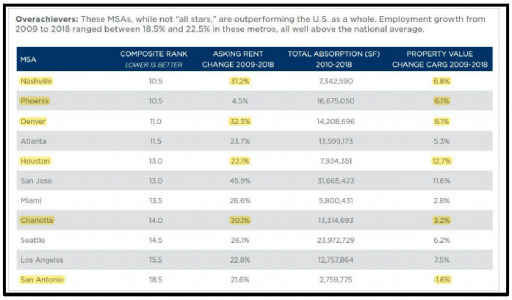 driving the current expansion (Phoenix, Denver, Nashville, Raleigh/Durham, and Charlotte, specifically) and 2) the continuing growth of our Southeast markets, the fastest growing region in the nation, per C&W. It may be observed that four of the 12 fastest growing MSAs in the U.S. are in Texas (Dallas, Austin, Houston and San Antonio), which is no real surprise because of Texas’s relatively low cost of living, corporate tax rates, and strong net-immigration.
C&W also highlighted the impressive gains in the Southeast region, as “the fastest growing region in the nation. Since 1990, employment in these areas have increased more than 73%.” Furthermore, highlighting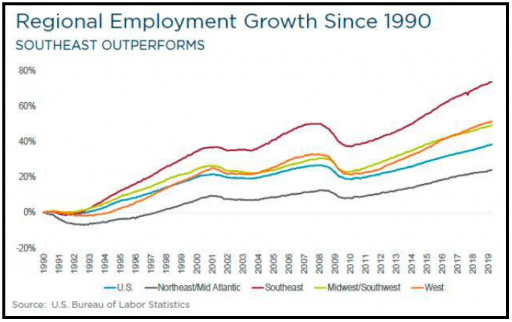 one of the primary reasons we have circled the Southeast as part of our target market scope, the report goes on to indicate that the “….Southeast has long been a magnet for people looking for a more favorable climate than that of the Northeast and Midwest. So as the population has moved south, so have the jobs.” As anticipated with ob levels trending strongly positive and a low cost of living, we have observed strong absorption, rent growth and substantial office value increases in the Southeast.
Our target market selection criteria include only cities (MSAs) which have greater than 500,000 non-farm payroll jobs, and we are excluding what the real estate investment universe considers the six “Primary Markets”. The result of applying this criteria yields two principal benefits: 1) these smaller “Secondary Markets” on average have a positive cap rate arbitrage of 100+/- basis points compared to the Primary Markets, a liquidity premium spread we believe is not justified and 2) the Secondary Markets have on average proven to have higher growth rates than the Primary Markets for some of the reasons indicated above.
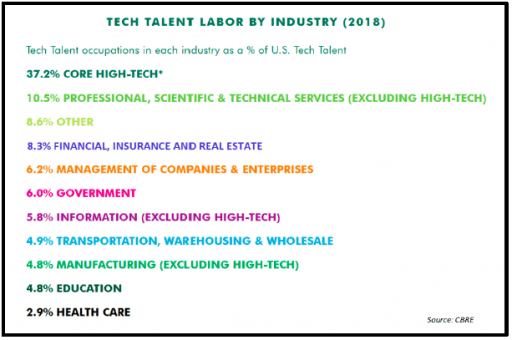 Among the reasons we are certain that our target markets will continue to perform as drivers of demand for office space as well as the other types of real estate is the strong representation of tech jobs in each of these markets. “Tech talent” is driven by various factors, and we want to take a few lines to highlight the real time effects of the “tech talent” in our target markets. According to CBRE Group Inc. (CBRE), tech talent is defined as a “group of highly skilled workers in more than 20 technology-oriented occupations driving innovation across all industry sectors”. A breakdown of the industries that are defined with “tech talent” are summarized in the table nearby, and it is no wonder that tech talent (jobs!) bleeds into various business sectors.
Per the latest CBRE Research report from July 2019, scoring “Tech Talent” defined by CBRE herein across the top 50 US and Canadian Markets, our 10 markets were ALL represented. Seven of our target markets are within the top 30 top tech talent markets in both the U.S. & Canada: Austin (#6), Denver, (#8), Raleigh- Durham (#10), Dallas-FW (#11), Salt Lake City (#15), Phoenix (#20), and Charlotte (#30). Our remaining three markets are within the top 50 tech talent markets: Houston (#34), Nashville (#45) (which seems low to us!), and San Antonio (#47) (also seems low given the nexus of young tech workers living and working in the San Antonio CBD). These rankings are clear evidence that our markets are retaining and growing tech talent which will sustain their long-term viability. A notable takeaway and one that allows us to further believe that the Secondary markets will continue to provide liquidity is that each of our markets are fueled by a younger generation of talent, “twentysomethings” (ages 20 to 29). The impact of tech in the commercial real estate is clear. CBRE: “the tech-industry has led the nation with major leasing activity [which] increased to 20% of total office demand in Q1-2019 from just under 11% in 2011, the largest single demand share of any industry”.
Our markets demonstrate strong job gains as of mid-year 2019, and if the last 10 years is any indication of future performance, then our target markets will continue to flourish. Further, the younger generation’s work force, a growing positive disrupter, will enable our markets to evolve and extend their overall pattern of growth long-term. Sustained continued rent growth indicates a structural shift in how technology can provide, per CBRE, “a cushion for markets during a downturn”. With the strong fundamentals underlying our target markets for strong “tech-talent” coupled alongside continued job growth, our current investment strategies are in an excellent position to succeed.
Macro-Economic Conditions
We had the theme of the summer down pat in the last quarter’s report, but the magnitude has surprised even us. In the Q1 report economics section we said: Perhaps the old saying “Sell in May and go away” should be appended with the phrase “…and buy bonds.” Boy, has that been the theme as the long maturity end of the bond market (10’s and 30’s) has been on a tear, with prices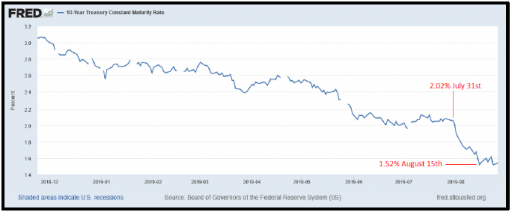 up and rates down. Way down! The yield on the U.S. 10 Year Treasury Bond (UST10) fell 50 bps in two weeks from July 31st to August 15th. The nearby chart shows the magnitude of this
steep decline relative to its more gradually sloping decline trajectory since the beginning of 2019. The inspiration for our quote above in May was a decline from 2.49% to 2.32% immediately prior to publication, itself a meaningful 17 bps plunge. Since its peak in late 2018, the UST10 has plummeted an astounding 175 bps from an intra-day peak of 3.25% all the way down to 1.5%. At the time of this writing, it is even lower still.
Naturally, all the talk now is about how the Fed is behind the “curve” and will have to cut short-term interest rates. At its meeting in late July, The Federal Open Market Committee (FOMC) of the Fed did affect the first reduction in the Fed Funds Rate in over ten years with its 25 bps move down to a target range of 2.0% to 2.25%. The last time the Fed lowered rates was in 2008, as the carnage of the Global Financial Crisis (GFC) was just coming into view.
What next? Will the Fed stand pat, or continue to lower? If it will lower, how much and how quickly? There are lots of opinions on that subject, and there is also a futures market where investors can risk their capital based on their best guess on the aforementioned results. We wish we had put our money where our mouth was when we said “buy bonds” in our last report!
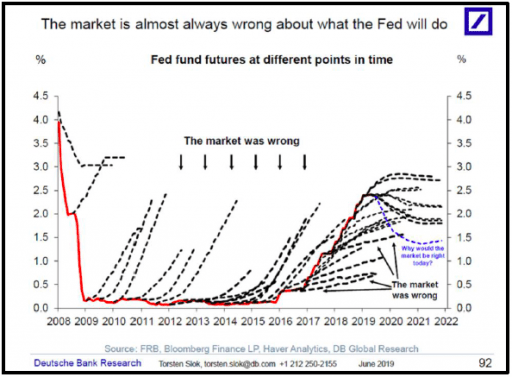 But how reliable is the Fed Funds Futures market as a predictor of where short-term interest rates are headed? Turns out, not very reliable. The nearby chart from Deutsche Bank Research is convoluted, but instructive none-the-less. The red line is the actual Fed Fund rate. It drops from around 4% as the Fed undertook monetary stimulus in the face of the GFC, hovering near zero for years after the GFC (likely a policy mistake) and then beginning to rise as the Fed finally began elevating rates in late 2015. All of the black dotted lines are the trajectory of Fed Funds rate as predicted by the Fed Funds Futures market at the point in time where the dotted line departs from the red line. As the Deutsche Bank comments and arrows indicate, the market is VERY frequently wrong. As recently as the first quarter of this year, the market was predicting several more rate hikes. The dotted blue line is what the market predicts will happen with Fed Funds rates now, or at least on the day the chart was created in June. If anything, the blue dotted line would be even lower at the end of August.
Our business does not involve day trading in interest rate futures, but interest rates are a key factor in our strategic planning process, underwriting, and asset management. What is most important to us is the direction of the trend line. Readers may recall that we felt strongly about interest rates peaking in 2018, specifically predicting a top in the UST10 at 3.25%, admittedly after adjusting our forecast peak up by 25 bps when UST10 broke through 3.0% for an extended period. Long-term rates did decline after U.S. growth peaked in 2018 and the global growth environment turned markedly down, in part due to trade uncertainty. The Fed, however, continued to raise short-term rates with the last 25 bps hike occurring in December 2018. It is evident now that short-term rates have peaked, and the trend is now down. As indicated in our report last quarter, we have previously adjusted our interest rate management strategy accordingly, and the most recent two loans we have entered into have used costless collars as opposed to interest rates caps, which we had been using when the short-term rate trend was up.
Are short-term rates headed down because the economy is about to enter recession? Certainly, the inversion of the yield curve has many pundits proclaiming recession is imminent. We called out the spread between the 3-month U.S. Treasury note and the UST10 as one of the more accurate indicators of recession in our Q3-2018 report.
Quick recap
The San Fran Fed published a study indicating that inversion of the UST10 to T3m (spread less than 0 bps) was the most reliable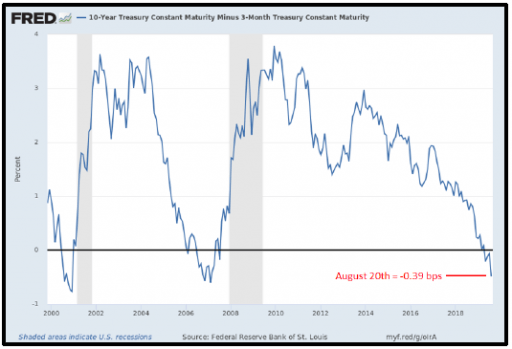 predictive spread across the yield curve. Here is a chart of the current conditions. As the UST10 has plummeted in the month of August, the spread has become meaningfully negative, at -39 bps it has reached a level not seen since just before the GFC. This does not portend well for avoiding a recession in the next few quarters. However, the countervailing argument states that interest rates around the rest of the world are so low that capital is pouring into the U.S. bond market as the best yielding and safest market, thereby dragging U.S. long-term rates lower than economic conditions would otherwise call for them to be. It follows from there that the inversion of the yield curve is a distortion caused by low and negative global yields and is therefore not a reliable indicator of results at this time. This time is different! Maybe?
Indeed, the current market value of NEGATIVE yielding global debt securities has surged to $16 trillion! As the European Central 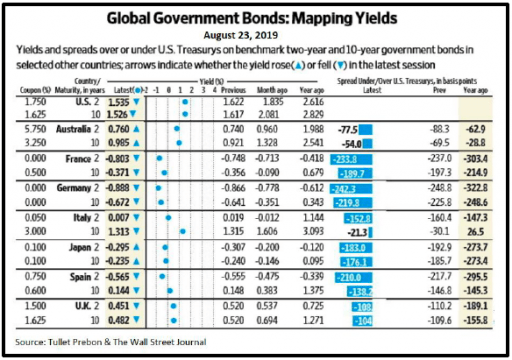 Bank is expected to restart its bond buying program this fall to stimulate an EU economy that is at the brink of contraction, it is only likely to grow. The nearby chart from the Wall Street Journal best illustrates the yawning gap between U.S. yields and those in other major economies, though currency hedging costs significantly reduce the spreads. We first presented our readers with this chart in Q4-2016. At the time, we were using it as one of the elements of support for our assertion about long- term U.S. interest rates not rising much above 3%. Well, the anchoring effect that we anticipated has now come home to roost, and the sharp decline in U.S. long-term rates likely is driven in part by the capitals flows out of negative yielding bonds in other markets around the globe.
U.S. rates have continued to decline despite a recent small uptick in inflation. As we have been reporting for several quarters, the general trend for inflation is down (see PPI chart nearby); however, the July 2019 CPI (consumer price index) posted a small rise,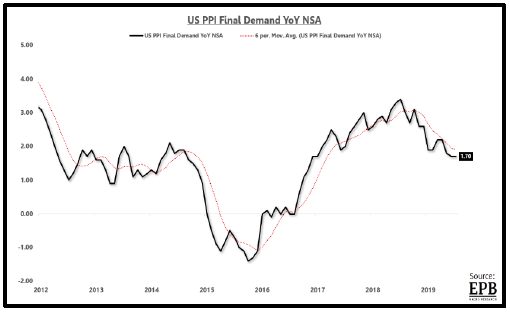 +0.3% month over month, and 1.8% year over year, versus 1.6% year over year in June. The uptick was driven primarily by housing (+3.02% over prior year) and medical, up 62 bps to 2.58% over prior year. The bond market ignored the July CPI print and continued to plow on towards lower yields. The recent fall in rates has also impacted the corporate bond market driving Moody’s long-term industrial company bond yields down to new multi-generation lows.
On August 14, the single-A industrial company bond yield closed at 3.30% and the Baa industrial yield ended at 4.08%. These are both less than each of their prior monthly averages going back to 1956.
These low rates will surely lead to more corporate bond offerings. Given the already leveraged condition of corporate America, it is our hope that most of the offering proceeds will be used for refinancing of outstanding bonds, loans, and commercial paper. We are confident that long-term rates will remain relatively low and the trend down for short-term interest rates now has a firm hold and will not reverse for some time. This is bad news for pension plans and good news for real estate prices.
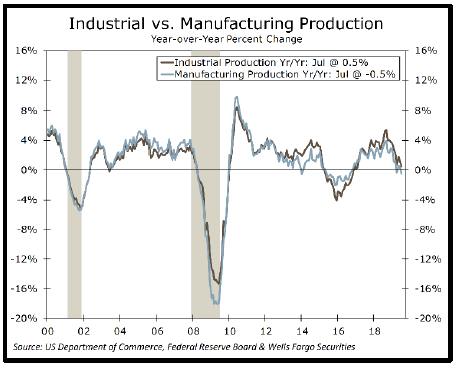 So is recession imminent, or will the strong U.S. consumer ride to the rescue and keep the U.S. out of recession? Consumers remain confident, and their balance sheets on average are in good shape. Net private savings is up to over $1.3 trillion, double its level coming out of the GFC. That is a meaningful cushion. Most of the slowdown in the U.S. appears to be in the cyclical industrial sectors. Manufacturing remains in negative territory, with output down in five of the seven months this year. However, the nearby chart illustrating the industrial and manufacturing contractions indicates present conditions are still not as bad as the energy driven manufacturing recession in 2015/2016, which was significantly deeper than what the U.S. is experiencing now, and even that did not pull the economy into recession at the time. 2016 was, however, the last instance when long-term yields were this low.
Sidebar: Who will win the trade war? China has limitations despite almost total control of its economy. China can’t allow its currency to devalue too much because, among other things, it needs dollars to service foreign currency denominated debt. If the currency markets are any indicator, with the yuan trading well above 7 to 1, a range not seen since before the GFC, the US appears to have a slight advantage and the global dollar strength may be the arrow in the quiver that forces some reasonable cease fire.