We began 2025 with generally positive tones based on continued improvement in transaction volumes, steadying interest rates (likely higher for longer), and an improving capital environment across all asset classes. So much so we stated in our year-end 2024 report, “…we see opportunities for improvement across all commercial real estate (CRE) sectors and overall optimism is prevalent…” Unfortunately, “liberation day” changed the tone of the market overnight. We have now passed the early days of that volatility, and the collective CRE world is cautiously optimistic. The large CRE data research providers we subscribe to have made “mid quarter” revisions to their 1H25 forecasts since Trump’s liberation day. Our topics in this quarterly report will be short on macro market trends and focus instead on items on which we continue to research and refine our opinions. Those include the following: 1) the continued “investment optimism” across the industrial sectors within non-coastal cities including our target markets, 2) e-commerce growth, again, as we did last quarter, and 3) return-to-office (RTO), which is slowly but surely evolving with a rhythmic drumbeat, at least on Tuesdays through Thursdays. We discuss how RTO is not all about when folks come to the office; it’s about where office buildings are located that will drive RTO. Next quarter will likely touch upon “Onshoring” since the inception of the Creating Helpful Incentives to Produce Semiconductors (CHIPS) Act and how it plays into our Industrial acquisition and development strategies.
The Table of Contents below can assist with navigating to a preferred section or getting a quick general take.
- Fund Updates: High level news on Fund activity.
- Real Estate Market Conditions: In this section, we will review:
- 2026 – 2028 Industrial Vintages ~ ripe with opportunity
- The Logistics Real Estate Boom, e-commerce (again)
- It's a Marathon, Not a Sprint in RTO (Return-t0-office)
- Macro Economic Conditions: Thoughts on:
- Geopolitical Dynamics and Economic Policies
- Future Path of Inflation
- Future Path of Interest Rates & the Yield Curve – Our House View
Fund Updates
Fund IV:
Airport Boulevard Industrial – Phase II, Houston, TX: During 1Q25, the Development TEAM was able to expand this project by a total of 224,673 square feet (SF) by acquiring an additional 22.9 acres adjacent to Phase I. The closing on this additional parcel occurred on May 21, 2025. Phase II will provide two (2) additional front-load buildings, a 204,747 SF building, 900’ x 220’ deep with a 185’ truck court and 56 trailer parking spaces and a 139,152 SF building, 798’ x 165’ deep with a 130’ truck court. The additional two buildings will provide space options for tenants ranging from 30,000 SF to 100,000 SF with direct access off Hwy. 288 via Airport Blvd. just 2+ miles south of Interstate Loop 610. In total, the TEAM will deliver a three (3) building Class-A industrial park totaling 568,572 SF with construction beginning in July 2025.
Real Estate Market Conditions
The following Griffin Partners Quick Takes summarize our latest observations on current CRE market conditions.
2026 – 2028 Industrial Vintages - Ripe with opportunity:
Transwestern’s (TW) latest report entitled “Finding the Markets that Succeed in Most Tariff Scenarios” highlight several investment opportunities in CRE, specifically within the Industrial and Multi-family sectors over the next 24+ months.
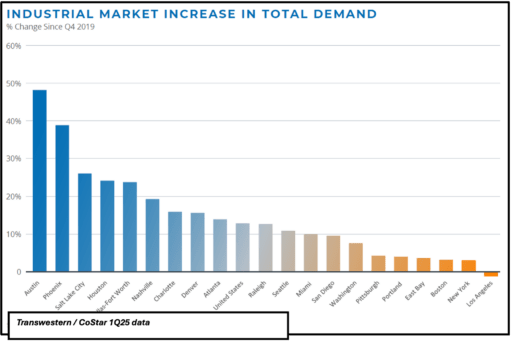
While many investors still have the “risk-off” view, we believe the data we see within our target markets support continued opportunities for our investors in the mid to long run. From a “macro” perspective, the continued “tailwinds” within our target markets will further strengthen demand for both industrial and multi-family, and to our benefit, specifically existing and new industrial product across Texas and the Sunbelt. The nearby chart shows demand growth across the US, from 4Q19 through 1Q25. Outsized growth has occurred in non-coastal markets. The top eight markets are ALL target markets for Griffin. Raleigh comes in tenth, and San Antonio, our only other target market, doesn’t qualify for the chart due to its limited size.
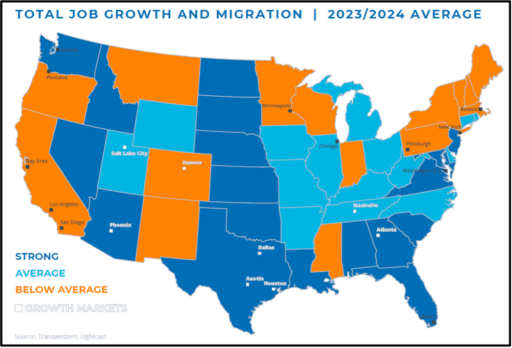
Tailwinds in our target markets include low cost of living relative to “primary” markets and pro-business government policies. These MSAs have above-average population growth compared to U.S. averages along with superior job growth, positive domestic in-migration which may prove more durable than coastal markets which depend more on international in-migration to grow. These factors support continued new supply AND net new demand as depicted above. While higher interest rates are hindering some developers’ ability to capitalize new developments, Griffin can “lean-in” into our next phase or “vintage” of investments. Our TEAM continues to uncover hard to find development sites in areas our peers may overlook, providing the potential for superior returns over the next several years. Further, as the nearby map depicts, 7 of our 10 markets highlighted in white are considered “Growth Markets” based on outperformance in both job growth and positive migration according to Transwestern’s report. TW’s report states “…markets that stand out for their potential in either a high or low-tariff environment, due to their attractive mix of the qualities….include the “Texas Triangle” of Houston, Dallas and Austin/San Antonio, Nashville, Phoenix, Raleigh and Charlotte. These markets have demonstrated strong demand growth since 2019.” It appears the Griffin Investment TEAM and the Transwestern Research team have similar views of best markets to be focused on over the next several years.
The Logistics Real Estate Boom (Dov Hertz Real Estate), E-commerce (again):
Quoting from an early 2025 Dov Hertz Real Estate Investment Blog: “…E-commerce has created an insatiable demand for logistics space. Unlike traditional brick-and-mortar retailers, which store inventory on shelves, online orders require significantly more warehouse space….” As we mentioned in our 4Q24 report “…projected E-commerce driven warehouse demand, shows material growth averaging 30% of net new demand across the US for the next three (3) years…” per GreenStreet’s year end 2024 report.
As Hertz provides in their early 2025 report “...every 1% shift from physical stores to online retail generates approximately 46 million square feet of net logistics demand in the US.” This additional demand will provide industrial assets or e-commerce logistics occupiers with a few unique traits as follows (per Hertz Real Estate):
- 100% Warehouse Storage: Unlike physical stores, all inventory for e-commerce must be housed in distribution centers.
- Additive operations or activities such as returns, processing, and customized packaging will increase space requirements.
- Consumer delivery will create space-intensive operations to facilitate direct-to-consumer deliveries.
As we mentioned last quarter, e-commerce growth could require an additional “….375,000,000 million SF of new industrial space…” if one assumed the U.S. had zero vacancy or availability rate. Dov Hertz notes overall net new demand in e-commerce could “…generate over 400 million square feet of additional logistics real estate demand in the U.S. over the next two to three years.”
It’s a Marathon, Not a Sprint:
We haven’t reported on overall office vacancies and return-to-office (RTO) for over a year, focusing instead on various macro level themes that included the dearth of office trades and the absence of debt financing. With volumes of office using data pre-COVID to now post-COVID, more than five years since the COVID pandemic in 1Q2020, we revisit how far the U.S. has come with workers returning to the office environment (either by their own volition or required) and we will set aside in this report the incredible capital markets volatility impacting office values.
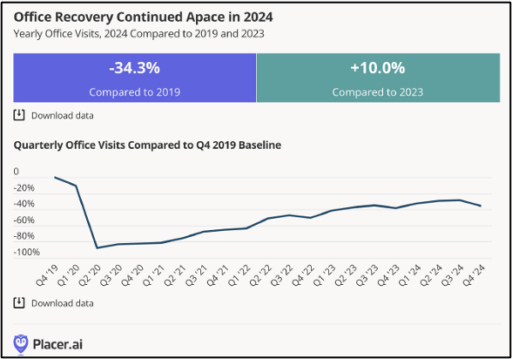
In 2Q23 we discussed how office asset values and office vacancy are bifurcated between the “haves vs. the have nots”. This still rings true today as the largest share of office vacancies, per JLL research, are concentrated in just under 15% of the buildings across the U.S. This 15% of buildings contains over 60% of the office vacancy. However, the utilization of the occupied space, according to the latest visits data from Placer.ai., has not reached pre-pandemic levels, but the methodical improvement in RTO continues. See nearby chart, which shows a positive trend of office visits. Visits are determined by tracking unique mobile phone location data.
The positive trend is interrupted periodically by a flat or declining quarter. Those interruptions occur in 4Q of every year because to baseline being compared to is the full year 2019 and not a quarter-by-quarter data set, so lower holiday visits result in a decline. Placer.ai’s report says office visits have slowly shown an upward trajectory with a “….fairly consistent seasonal pattern. Q1, Q2, and Q3 of each year, office visit levels increased steadily before dipping in holiday-heavy Q4.” 4Q24 saw the same slight decrease in visits.
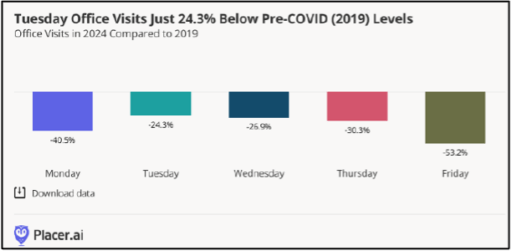
Breaking this down further, we were curious about the timing in which tenants are utilizing their space during the work week. Knowing that data can assist our TEAM in improving ways to manage and operate our existing assets for the benefit of our community members and better underwrite once we return to investing in office properties again. The two workweek utilization graphs nearby provide a daily view comparison of pre-Covid (2019) and post COVID (2022, 2023 and 2024) office visits by each day of the week.
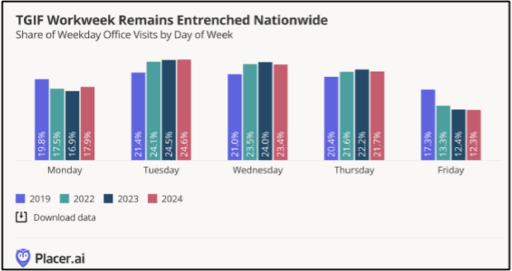
Unsurprisingly, Monday and Fridays are the least utilized days of the week, and Tuesday, Wednesday and Thursday are the leaders in the clubhouse in the RTO game. What is interesting is the overall trend is moving up and to the right for each day except Friday. The other four days are continuing to take share away from Friday with the middle three above 2019 pre-COVID levels. As a reminder this data is unrelated to total occupancy, but is daily share of office attendance across the week.
Also interesting and playing into Griffin’s general thesis of preferring to invest in Suburban vs. CBD office assets, the data indicates an “Urban Shift” is occurring relative to how far folks will go to check in and sit at their office desk. Per the latest data and from RTO: Recovery Still Underway” 1Q25 article “…Placer.ai’s proprietary RTO dashboard shows that visits originating from areas closer to office locations have recovered faster than visits from farther away – indicating that people living closer to work are more likely to be back at their desks...” What a novel concept, of course folks would be more prone to going to their office (RTO) if it’s a short commute versus driving or taking some form of public transportation that will take 45 minutes or more.
Per a recent post on LinkedIn from Brad Hargreaves, (click here for this quick 2-minute read and thanks to Patrick Keltner, Griffin Partners Managing Director of Innovation for providing) he unpacks the RTO progressing in a very simple fashion, “…the winners in commercial real estate won’t just be quality buildings. They’ll be quality buildings in the right locations.” Brad Hargreaves goes on to state, after interviewing Jamie Hodari the founder of Industrious, a co-working company with over 150 locations across the US, and recently acquired by CRE giant, CBRE in January 2025 for $800 million, that RTO “is about bringing offices back to where people actually live.” And, post-COVID, workers have finally reached a breaking point and have made a shift in their daily lives and routines to have a better work/life balance. Said differently, he goes on to state “….offices (buildings) got a free pass on this fundamental human behavior ~ people want and are now requiring (per the Placer.ai data) an easy commute...” in their cars or a short walk from where they live. Industrious data supports this notion, and Jamie Hodari provided the following when it comes to Industrious’ locations regarding “RTO” customers:
- Industrious locations fill 3x faster than downtown offices
- Mixed-use developments are commanding record rents
- Tech companies are opening satellite offices closer to where employees live
- Buildings connected to residential areas outperform isolated towers
The simple idea of a short commute from where you live (data supporting) reinforces our continued thesis of investing in suburban office locations near residential communities with live-work-play attributes. This thesis will support the occupancies of the assets we invest into the future. There will be much more debate and data forthcoming in future quarterly reports on this ever-evolving RTO recovery. Griffin will continue to drive our decisions through data, which is why we believe pragmatic and patient investing leads us to the old adage that “It’s a Marathon, Not a sprint!
Macro-Economic Conditions
Geopolitical Dynamics and Economic Policies
Continuing our theme from last quarter, the global economic landscape is undergoing significant transformation driven by geopolitical shifts, economic policies, economic statecraft and structural changes. Large imbalances, some decades in the making, are beginning to unwind. While the tariff machinations have certainly been a catalyst, they are in many respects a symptom, and maybe less so the underlying cause. This report highlights some of these dynamics and will culminate in our assessments regarding the likely future path of interest rates and the yield curve.
Geopolitical Dynamics and Economic Policies
A national current account deficit (trade deficit) is the opposite equivalent or mirror image of a national capital account surplus. They represent the two halves of a nation’s balance of payments and must equal each other over a given period of time. As described last quarter, “…the western democracies [including Japan] acquiesced to a deal post-World War II in which the U.S. would open its economy in exchange for other countries buying U.S. treasuries [and other securities] and trading goods in U.S. dollars….” The U.S. would be a net importer of goods and a net exporter of dollars. This arrangement was successful in accomplishing two of its primary goals, namely rebuilding the war-torn U.S. friendly economies and establishing the U.S. dollar as the world’s reserve currency. The issuer of the reserve currency MUST run a trade deficit to supply the reserve currency to the rest of the world for the conduct of trade and to hold in reserve. Why did the U.S. geopolitical strategy incorporate establishing the reserve currency, with its privileges and burdens (more on those below)? Primarily because one of the privileges is great leverage to shape the geopolitics of other nations, which was important with respect to their alignment during the Cold War. With the Cold War over, the importance of that leverage is diminished. Not coincidentally, the dissolution of the post-World War II liberal order (“LWO”) is underway, and the rise of a bipolar world order is reshaping global economic dynamics, with the Western bloc led by the United States and the Sino-Russian duo-pole leading the other bloc. The shifting geopolitics is accompanied by the gradual unwinding of significant economic imbalances which have built up over the roughly eight decades of the LWO. A number of those imbalances are the result of the U.S. abusing its privilege of having the reserve currency. More on that below.
The geopolitical expert George Friedman was recently featured in John Mauldin’s “Thoughts from the Frontline” making some interesting points which we are seeing play out in real time. Friedman argues that the Cold War truly ended not with the fall of the Soviet Union, but with Russia’s failed invasion of Ukraine in 2022. This failure exposed the limits of Russian military power and invalidated the long-standing assumption that Russia could threaten Western Europe. As a result, the U.S. no longer needs to maintain a large forward military presence in Europe. Drawing on Alfred Thayer Mahan’s sea power doctrine, Friedman emphasizes that U.S. security has always depended on control of the Atlantic and Pacific Oceans. With no credible land-based threats from Canada or Mexico, and with Russia and China unable to project naval power effectively, the U.S. has returned to a maritime-centric strategy. The U.S. is now reducing its military and economic commitments abroad, including scaling back military obligations in Europe especially, reassessing trade imbalances that were once tolerated for geopolitical leverage, and imposing tariffs and reshoring production to reduce dependency on adversarial nations like China. Historically, the U.S. used economic incentives like the Marshall Plan and access to American markets to secure alliances and contain Soviet influence. That strategy is now considered obsolete. The U.S. is shifting toward economic self-reliance and strategic decoupling, especially from China. Friedman warns that the U.S. reliance on Chinese exports, especially critical components, poses a geopolitical risk akin to the 1973 Arab oil embargo. If China were to impose an embargo, it could severely disrupt the U.S. economy. This risk is driving the U.S. to reindustrialize and diversify supply chains.
Economic Implications
As traditional frameworks are breaking down, it is important to remember that capital moves faster than trade. The Trump administration’s aggressive tariff and fiscal policies have accelerated the global shifts described above, and capital flows are reacting much more swiftly than most trade flows, with China’s exports to the U.S. being perhaps the only exception given the paralyzing level of the initial tariff regime. As for the economic implications, the U.S. may be facing a policy-induced slowdown in growth, as evidenced by the Q1 negative GDP print of -0.3%. Q2 U.S. soft data has continued to deteriorate but as of yet, hard data has not followed.
Conversely, to the extent the figures can be trusted, China grew by an annual rate of 5.4% in Q1. Both nations figures could have been significantly impacted by front running of the anticipated and delivered tariffs. Elevated exports increase GDP, and conversely elevated imports reduce GDP. It is hard to gauge which of the two nations, if either, has the advantage in the current economic sparring. China’s political construct does allow for more patience and longer-term objectives. External pressure is being used by the CCP to consolidate internal political unity and reinforce nationalistic sentiment.
Long-Term Implications
Key elements of China’s long-term strategy include China’s emphasis on strategic depth, patience, and positioning over time rather than short-term tactical wins. China is investing heavily in automation and AI to offset demographic challenges and reduce reliance on cheap labor, aiming to sustain its manufacturing dominance. China is also exploring in collaboration with a few other nations a currency backed by commodities as an alternative to the U.S. dollar. The pitch is that a commodity-backed currency should appeal to countries seeking more stable and tangible monetary systems. Not much progress of significance can be pointed to on this alternative currency front, and many professionals are skeptical. However, like the limited amount of oil now trading in non-dollar currencies, it is something to keep an eye on. Despite economic headwinds, China retains capacity to stimulate its economy, especially through targeted fiscal support and industrial policy. In the long run, China's economic statecraft, focused on market share rather than profits, challenges the LWO. While its demographic decline poses challenges, China’s advancements in automation and AI could offset labor shortages. However, its model is not exportable, and global pushback against its dominance is increasing.
Future Path of Inflation
The transition to economic statecraft and geopolitical shifts is inflationary, as nations rearm and rebuild supply chains. Traditional market indicators like CPI and Fed decisions may become less relevant compared to statecraft objectives, or at least in conflict at times. The future path of inflation will be influenced by a combination of geopolitical dynamics, economic policies, and structural changes. All else equal (it never is!), the likely scenario involves a period of higher-for-longer inflation, driven by the need to address global trade imbalances and economic sustainability.
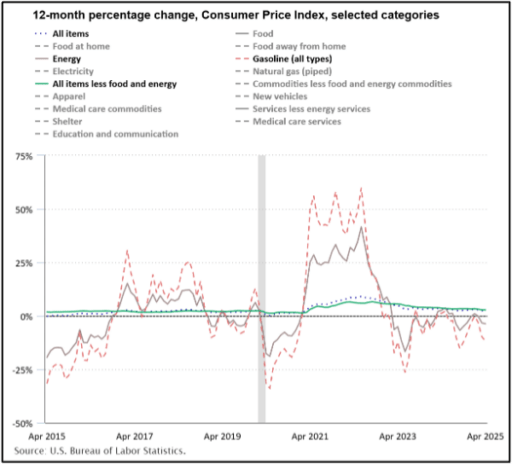
Inflation is likely to remain elevated in the near term, with core inflation measures indicating persistent price pressures. However, as the effects of tariffs and supply chain disruptions wane, inflation may gradually decline towards the Federal Reserve's target of 2%. April data from the Bureau of Labor Statistics (BLS) indicates that the Consumer Price Index (CPI) rose 2.3% year-on-year, down from 2.4% in March. The core inflation measure, which excludes food and energy, was up 2.8% year-on-year in April. Energy prices decreased by 3.7% over the 12 months ending April 2025. Long time readers know we believe that oil prices are the single greatest influence on inflation over time. The nearby chart from the BLS website, which breaks out for comparison both energy and gasoline, illustrates that influence.
The core CPI has increased at a 2.1% annualized rate over the past three months, indicating deceleration. This marks a continuation of a slow but steady trend toward lower inflation in the U.S. However, many are concerned that higher tariffs threaten to derail this trend. Analysts expressing that concern assume that the U.S. consumer has the capacity and desire to continue to spend on all items, discretionary and nondiscretionary at the same pace. We are not as confident in that assumption. Also, a continued deceleration in services prices should help offset some impact from higher goods prices. Hoisington Investment Management believes the recessionary effects of tariffs, supported by compelling historical evidence and economic theory, will dominate the inflationary ones, potentially leading to a significant reduction in world trade and capital flows.
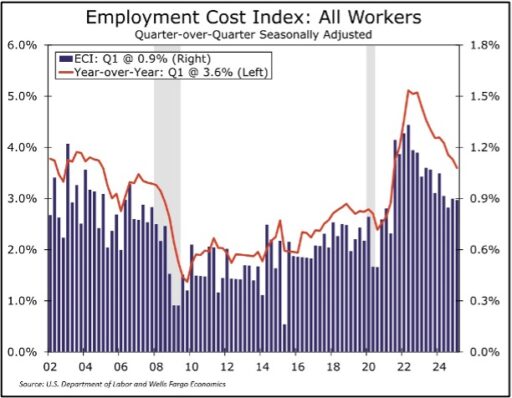
Lastly on inflation, back in our Q3-2022 report we drew attention to the Fed’s use of the Employment Cost Index (ECI) as one of its three primary metrics for assessing inflation. The primary reason the Fed prefers the ECI is its control for compositional shifts in the workforce. Benefit Costs rose 1.2% in Q1, up 3.8% year-over-year. Some Good News for the Inflation outlook, ECI Labor costs rose 0.9% in Q1-2025, bringing the year-over-year increase to 3.6%—the slowest pace since 2021. This moderation suggests a cooling labor market and reduced inflationary pressure from wages. Wages and salaries increased 0.8% in Q1, with a year-over-year rise of 3.5%. The ECI shows more subdued wage growth compared to other measures such as Atlanta Fed Median Wage Tracker at 4.3%, and Average Hourly Earnings at 4.4%. Health insurance costs surged 5.4%, the steepest annual increase since 2005, driving much of the benefit cost growth.
Despite high growth in employee benefit costs, the overall moderation in employment costs supports the view that the labor market is not a major source of inflation. However, future easing in employment cost growth may be limited due to slower labor supply growth (e.g., reduced immigration) which may be offset by improved labor productivity since the pandemic. Higher productivity should help offset inflationary risks from compensation growth.
Exorbitant Privileges and Burdens
The U.S. dollar is extensively used globally, with about 60% of the world's foreign exchange reserves held in U.S. dollars and 80% of cross-border trade invoiced in U.S. dollars. This widespread use creates a tradeoff between domestic macro stability and fiscal sustainability.
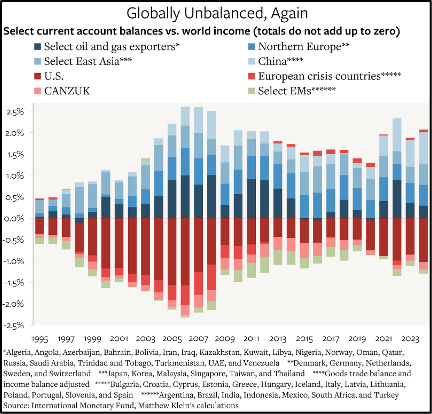
The exit from the pandemic saw the return of large global imbalances, driven by China's surplus and the corresponding increase in the U.S. current account deficit. See nearby chart. This means that on net the U.S. has been providing dollar-based securities to the rest of the world fueled primarily by federal government borrowings, illustrating a degree of linkage between the current account (trade) deficit and the fiscal deficit.
Thankfully the unusually large federal budget deficits of recent years have been offset by the relative conservatism of the American private sector and state and local governments. Private sector balance sheets are in a good place overall.
Obviously, there is a great debate underway regarding the current fiscal situation. While recent fiscal deficits are clearly out of an appropriate equilibrium, ideally federal government borrowing should balance the needs of both the domestic private sector and the aggregate net demand for financial assets from the rest of the world. In the absence of a larger global rebalancing, which is unlikely, this approach would help ensure that there is enough spending to keep domestic businesses investing and hiring while minimizing the need for excessive private borrowing, which has led in the past to private debt bubbles like the lead up to the Global Financial Crisis (GFC). Most likely the correct level of deficit to GDP is around the 3% proposed by Treasury Secretary Bessent, well less than the 6%+ of recent years.
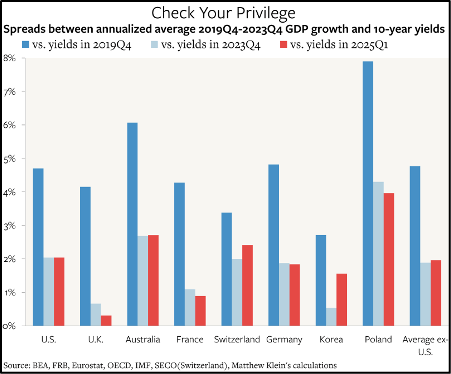
Are we privileged? Because of the dollar’s reserve status, Americans benefit from being able to borrow more and theoretically at lower borrowing costs, but we have the corresponding burden of needing to borrow large sums to keep the economy operating close to full capacity. But do we Americans have a lower borrowing cost? A look at the data indicates that the U.S. does not stand out in terms of borrowing costs relative to nominal income growth when compared to other rich countries. The best way to compare borrowing costs between nations is to compare the spread between each nation’s GDP and its 10-year bond yields. As can be seen in the nearby chart, the U.S., both before and after the pandemic, does not stand out in comparison to other developed economies.
Future Path of Interest Rates and the Yield Curve
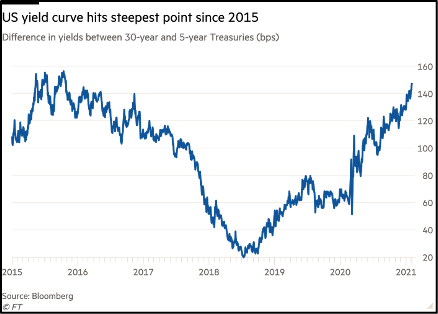
The Federal Open Market Committee (FOMC) met recently and held the fed funds rate unchanged in a range of 4.25% to 4.50%, marking the third consecutive time the result of the FOMC meeting has been to hold rates steady at the short end of the yield curve. The FOMC stated that uncertainty about the economic outlook has increased further, and the risks of higher unemployment and higher inflation have risen. Meanwhile, the long end of the yield curve has been drawing most of the attention. As the global economy adjusts to the new geopolitical realities and structural changes, a gradual steepening of the long end of the yield curve should continue along the path in place since exiting the pandemic. See nearby chart.
Of note, the Fed has slowed its balance sheet runoff, a process called quantitative tightening, or QT. At its March 18–19, 2025 meeting, the FOMC decided to slow the pace of QT starting April 1. The new policy includes reducing the Treasury runoff cap from $25B to $5B/month and keeping the mortgage backed securities (MBS) runoff cap at the current rates of $35B/month, though actual runoff is averaging only ~$17B/month. What is the rationale for slowing QT? While benign conditions in the liquid money markets and stable bank reserves would allow for continuing at the same rate, it is likely the Fed wants to avoid a repeat of the 2019 repo market disruption. Additionally, over $2 trillion in securities have already been shed since June 2022, and it appears the Fed is beginning to consider the current level of bank reserves as close to an appropriate target.
When will QT end completely? According to the economists at Wells Fargo, QT is expected to continue at the current slower pace through end of 2025. By early 2026, the Fed is projected to pause QT and hold the balance sheet flat until mid-year. At that point, bank reserves are expected to fall to around $2.8 trillion, near the Fed’s comfort zone. As for longer term Strategy regarding the Fed’s balance sheet, the Fed aims to stabilize the reserves-to-GDP ratio around 9%. Even if the balance sheet is held flat, it will shrink as a share of GDP over time. The Fed plans to continue MBS runoff indefinitely, replacing them with Treasury securities to reduce support for the mortgage market. The total QT reduction (~$2.5 trillion) is estimated to exert 20–40 basis points of upward pressure on long-term interest rates.
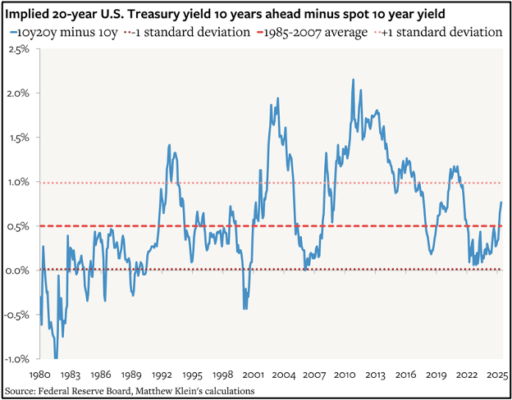
The recent rise in long bond yields relative to medium-term note yields has been viewed by some as rather rapid and alarming, but the resulting spread and therefore the implied risk premium is not obviously abnormal. What is emerging is a return to a more normal duration premium. The nearby chart indicates the current duration premium, as measured by the spread between the 20-year U.S. treasure yield 10-years ahead (future 20-year) and the 10-year yield, is close to its long term average over the pre GFC period of 1985 through 2007. It has risen from close to zero at the peak of the pandemic and is currently slightly above the long-term average, but it is well within one standard deviation, signifying a relatively normal market.
Our house view anticipates overnight rates falling by 75 to 100 basis points over the next 12 months to settle in a rage around 3.25%, and for the 10-year to remain in its current range of ~4.5% to 5%.
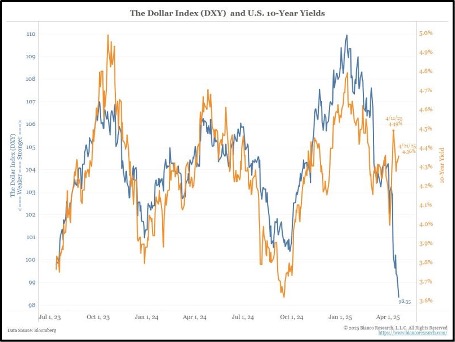
So, everything is hunky dory, right? For those needing something to fret over, it could be wise to keep an eye on capital flight out of the U.S. The policy shifts discussed above have triggered some degree of capital flight, weakening the dollar and contributing to the rise in long-term Treasury yields. The usual correlation between Treasury yields and the dollar has broken down, as seen in the final chart. If the spread widens as a result of 10-year yield breaking out above 5%, we may start to hear whispers about a return to QE. Worth watching………