We hope this finds our readers excited for the approaching summer break while acknowledging we all should be mindful of those caught up in the war in Ukraine and the recent tragedy in Uvalde, Texas. In late 2019 we touched upon co-working and how collaboration is a vital aspect of a thriving office environment. As of part of that quarterly report we stated that “….corporate or large office users (as well as small occupants) could fundamentally disrupt office occupancy and the long-term value of office assets.” This continues to be relevant today with open questions about the return to the office and how office asset values will evolve. We remain confident that the “death of office” is not upon us as we continue to observe positive movements in workers returning to the office. This quarter we will share a few relevant statistics on the return to office, opinions from thought leaders on its overall return, as well as office values and how obsolescence is top of mind when we are pricing office assets. Further, we will provide as in our last quarterly report, a few “GP Brief Takes”.
See the Table of Contents below to assist our readers with navigating to a preferred section or getting a quick general take.
- Fund Updates: High level news on our Fund activity.
- Real Estate Market Conditions: In this section we examine the following:
- “GP Brief Takes” from the last 90 days including 1) the drumbeat of continued rising interest rates and the surprising continued aggressive pricing on existing Class A suburban office assets, which we expect to temper soon and 2) recently delivered single-tenant long-term leased industrial projects are seeing cap rate expansion.
- The continuing progression of the return to the office post-COVID as well as what employers resoundingly want and how employees are slowly coming back to the office. We will also cover the relevance of efficient office buildings and steps we’ve taken, post-COVID, to maintain our office portfolio.
- Macro-Economic Conditions: In this section will assess the trajectory and likely peaks of inflation and interest rates. We admit to being wrong on our prior quarter’s assessment. Although, we cleverly put in a caveat last quarter that gets us partially off the hook. In sum: inflation more pernicious and likely to last longer that we previously thought, and short-term rates will have a higher peak, but could be falling again sooner than some expect.
Fund Updates
Fund III: The sale of our Park 109 industrial project in Nashville, TN has now officially closed as of March, 2022. We were fortunate that the final investment returns greatly exceeded our expectations.
Fund IV: Griffin Partners Value & Income Fund IV (“Fund IV”) remains open for new commitments through year-end 2022. Fund IV made two existing cash-flowing office investments during 4Q21 in Charlotte and Houston. In 2022, the TEAM has been busy as we have increased Fund IV industrial pipeline with three speculative industrial projects:
- Lebanon Logistics Center (“LLC”), in Nashville. This site plan approved and fully entitled 2 million square feet Class A industrial park will total three (3) buildings on 250 acres of land approximately one mile south of our recently delivered and sold Park 109 industrial development.
- Saturn Crossing, in southern Nashville. This 202,000 square feet, two-building front-load Class A industrial project sits on 19.5 acres of entitled and now site planned approved land.
- DFW Inland Port or Port 45, in Dallas. This 567,500 square feet, two-building front-load speculative Class A industrial project sits on 37.25 acres of entitled and site plan approved land.
At this point, we are in the early innings of Fund IV’s life cycle, and we continue to monitor our allocations across both office and industrial projects. We are optimistic about continuing the pace for deploying Fund IV capital efficiently across both sectors within all ten target markets…four markets down (Charlotte, Dallas, Houston, and Nashville), and six to go!
Real Estate Market Conditions
The following are a few recent observations on current commercial real estate (“CRE”) market conditions coupled with a few pages of more detailed material. First, real-time “GP Brief Takes” for this quarter:
- Institutional and High Net Worth capital continues to invest in office: We are continually underwriting and bidding on various office projects throughout our target markets. In the last three months, we have seen pricing levels for suburban core assets trading at pre-covid cap rates and average equity cash on cash metrics have trended down to the mid-single digits (6%+/-). According to Real Capital Analytics (RCA) Commercial Property Price Index (CPPI) during the month of February, the index recorded a 19.4 percent increase year-over-year. We think this will continue but the pricing premiums will be tempered and perhaps cool in the short run as interest rates rise. However, we do not expect competition for quality office assets to slow significantly. A clear signal of moderating valuation premiums, average commercial loan sizes in the US are trending down from $21.1 million between 2015 to 2019 to now in 2021, $15.7 million and average loan-to-value (LTV) ratios are declining (per Wealth Management Research Analytics (WMRA), March 30, 2022). If you read last quarter’s report, appraisals are partly to blame or point to, lessening total loan proceeds, which is not a bad thing.
- As of 1Q22, our markets did not exhibit a slowdown in pricing expectations for office assets. The slack in or delay in buyers underwriting appropriate interest rate movements upward or the lack of education by investors not underwriting interest rates increases at the short end of the curve was the most likely the cause for continued pricing increases. For example, most recently in Phoenix and Raleigh suburbs, we have witnessed strong evidence that institutional investors and high net worth or family offices are actively “bidding up” assets that have at least 4 years of weighted average lease term (WALT) in the last 90 days. At the time, buyers were solving to mid-single-digit average equity cash on cash over a five-year period. This surprisingly low cash on cash return translates to mid to high five 5% going in yields for office assets that are around 90% leased, a thin yield arbitrage in our opinion. This arbitrage, if not underwritten appropriately from an interest rate perspective and capital consumption perspective, is a losing proposition. If these buyers close, they will likely miss anticipated return expectations. For that reason and various others, we continue to stay in front of building owner’s / seller’s sale reps as their selected buyers will either “eat the difference” in these new return expectations and hold to their agreed-upon price or “re-trade.” Re-traders are going back to the Seller to reduce the price in order to hold anticipated returns (assuming they have financing contingencies, which most do). This friction creates opportunity in our eyes, and we’ve been successful in purchasing assets when these discussions or this dislocation occurs. As we have witnessed, sellers on occasion will pivot to buyers that underwrite their debt and capital appropriately. Further, as an example of the continued rising lens on how buyers are underwriting debt, we frequently have “buyer interviews” when sellers narrow the field to only a few potential buyers. Just a few weeks ago we made a compelling offer on a $30 million Salt Lake City office asset. A relatively small institutional trade, and to our surprise, on the “buyer interview” the Vice Chairman of Capital Markets for a well-known brokerage firm representing the seller, who we knew well, was 1) on the phone call for a relatively small transaction which was a surprise, and 2) begin peppering us with questions about our debt underwriting. This occurrence, and others we could provide, clearly signal that sellers and their representatives are starting to take keen interest (pun intended) in qualifying their buyers in light of less favorable debt conditions. Unfortunately, this Salt Lake City office has been put on hold as the seller decided not to sell and pivoted their focus to selling another asset in the submarket. For now, we are keeping that asset on our “watchlist.”
- Single-tenant industrial sale cap rates are going up: Various factors have slowed this industrial sale category. First, most investors buy into the ethos that industrial rents will rise across the US, and this will continue for the next three to five years until new supply finally catches up to overall demand, and second, interest rates are going up in the near term. These factors have pushed single-tenant cap rates up between 50 to 100 basis points in the last 30 days. For example, a newly developed 1,200,000 square feet industrial project leased to Walmart for fifteen years with two (2) percent annual rent bumps was initially priced at a 4% cap rate, market participants believe the asset will likely trade closer to a 4.75% cap rate (75 basis points higher) because industrial rents are projected to rise considerably faster than 2% per year in the near term, rendering the in-place rent stream less valuable. Additionally, since interest rates are up in turn, an owner would incur negative leverage when paying a price equating to a 4% yield and borrowing at 4.25% or more. Why is this relevant? A number of institutional buyers in today’s environment would rather take the “rent growth risk” and “hedge interest rates” in the short run than buy a long-term investment-grade credit lease that is below market rent with contractual 2% annualized rent increases pushing future rent even further below market. Investors are now more attracted to and will pay a premium for multi-tenanted industrial assets that are either not leased or have a short WALT to bet on future rent increases. Could this be smoke, or a canary? Vacancy in some cases is now worth more than long term occupancy? We’ve heard this before!
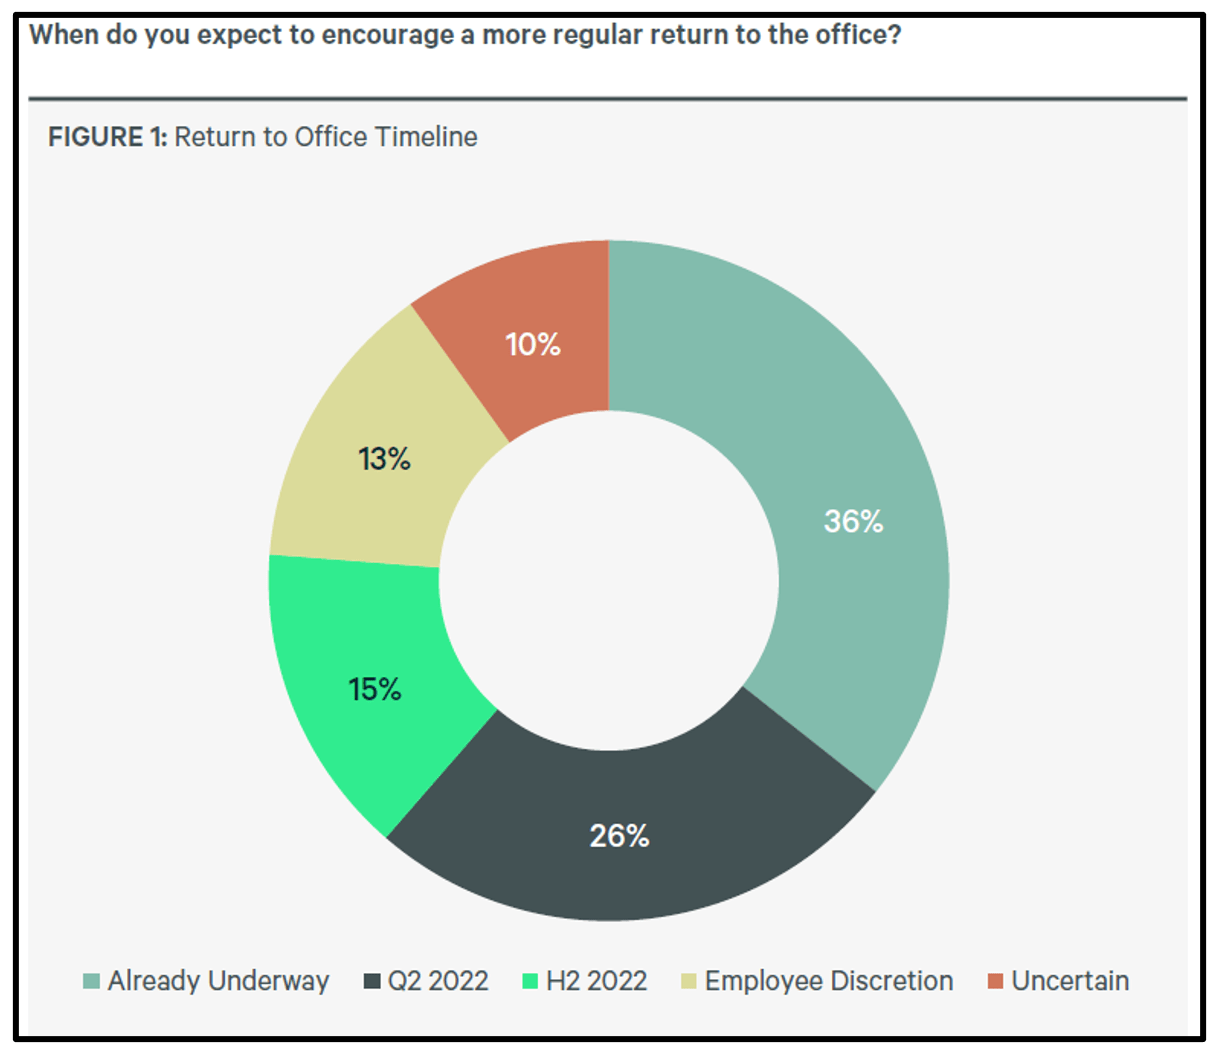
As we see declining COVID cases throughout the U.S., at least relative to the peak of Omicron, office usage is slowly returning. It’s clear that return-to-office plans were limited in 2021 as implied in our report last quarter with our “economy bobbing and weaving in all directions like a butterfly” (Peter Linneman). Unfortunately, we believe this will continue. Although, as COVID becomes less impactful, we believe office usage will continue to gain steam throughout 2022. Per CBRE’s U.S. Office Occupier Sentiment Survey, illustrated in the nearby chart, 77% of surveyed companies indicated they will have a full return to the office underway by H2 2022, and only 10% of the respondents were “uncertain” of their office timeline return. It is clear companies are doing all they can to have employees engaged and more importantly productive within the built environment. Evidence of this movement by company business leaders to either force, induce, cajole, or incentivize their employees back to the office is summed up in the following statistic, “…85% of respondents want employees in the office…” per CBRE’s Survey. Executives want this to occur for various reasons, but in short, the “C-Suite” want their “…employees in the office for collaboration, teamwork, connectivity, culture, compliance and mentorship.”
Further, an insightful comment by CBRE’s Workplace Strategy Executive Managing Director, Lenny Beaudoin, stated “…the most important employee amenity in the return office…is other employees.” We can’t agree more. On that note, there is an abundance of implementation in the arms race for amenities in office buildings. So much so, that tenants and landlords need to think about how many of these intrinsic motivation tools they need to add, (e.g., glass walls, open cubes, ping-pong tables, beer on tap in the kitchen, workout rooms, corn-hole, mini-break rooms, foosball tables, full coffee bars, zen rooms, etc, etc…) before the employees are distracted from the work they are there to do.
A recent article by Elizabeth Seay from the Wall Street Journal, Obstacles For Hybrid Workplaces, stated [paraphrasing] “…companies that invest in intrinsic motivation - encouraging, for example, sincere compliments are likely to enjoy enhanced competitive advantage at the workplace….and the hybrid work environment.” For collaboration and in-person meetings versus employees working remotely, as Ms. Seay stated “it’s time for companies to start paying attention to this interaction and its impact on human capital.” These items speak to employees’ mental health and working from home can present unintended issues.
For example, employees working from home are more likely to feel stressed compared to their colleagues in the office (55% vs. 36%). Employees that work from home provide employers more free time each week, an extra 8.7 hours on average compared to those in the office only 6.5 hours on average. Those working from home tend to log on earlier, stay later, take fewer breaks, etc… and effectively are “always on” . This creates an imbalance for employees and creates long-term mental health issues which relates to our previous comments about creating a positive and rewarding culture for an office environment as employees are the greatest asset to success. If employees are not present, they struggle to feel connected.
As stated above, executives want their employees back in the office, and on the other side of the coin, approximately 80% of employees want to work two days per week remotely per the recent 2022 EY Work Reimagined Survey. How do we move forward? It’s a balance, we hear it over and over. The key to employers’ success is defining a clear policy from the decision-makers or “C-suite.” Once this occurs, it provides a definitive guide for employees to be back in the office and their behaviors will follow suit. There is a balance of how office space will be used in various industries, and each will have varying degrees of contraction, expansion and some no change at all in the amount of space required. The trick will be to understand in our future investments which industries or companies will fall into these varying degrees of office use.
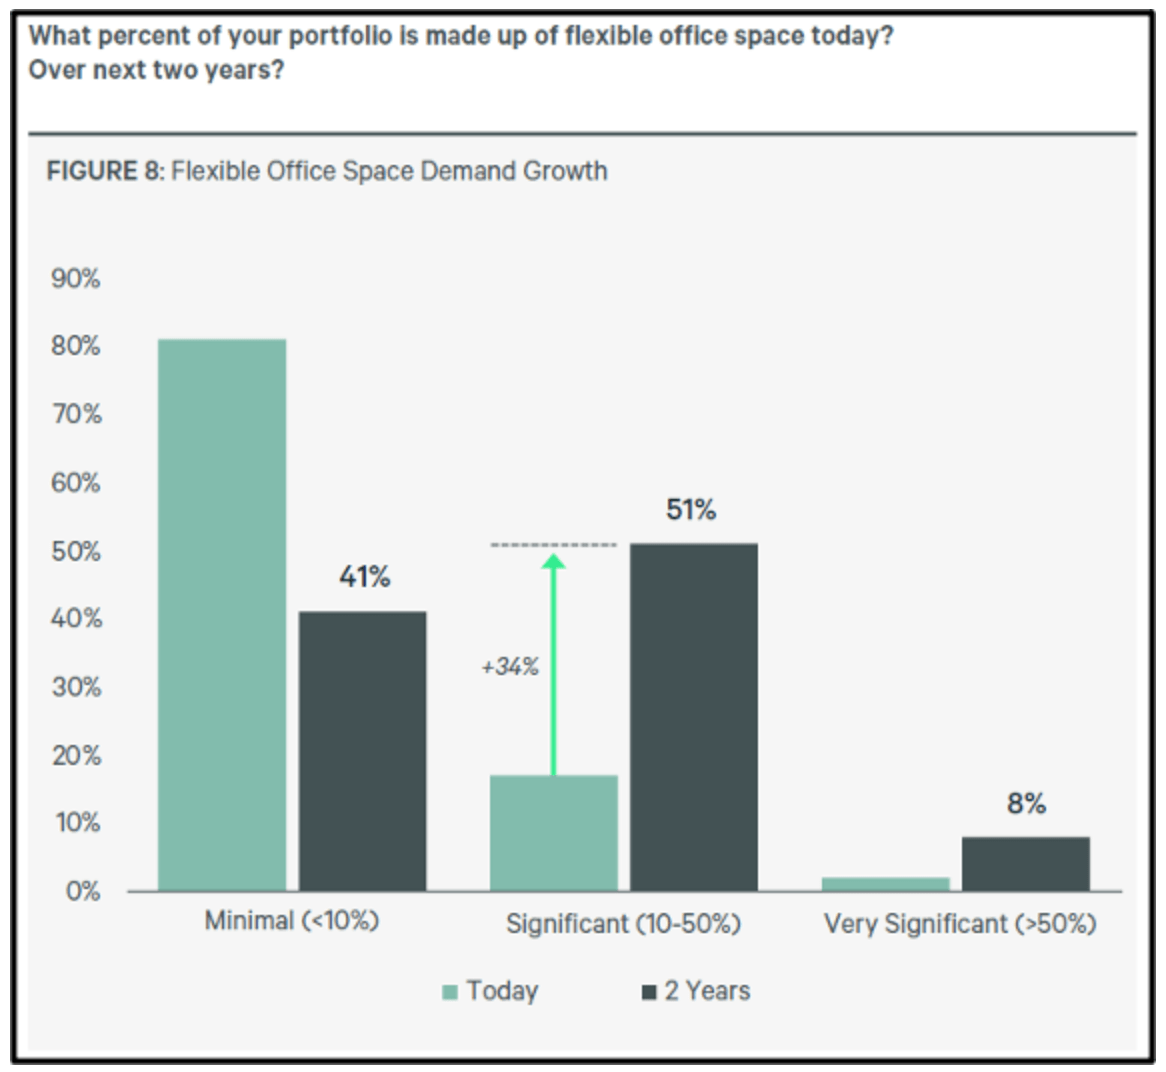
As indicated in CBRE’s U.S. Office Occupier Sentiment Survey, companies are now, more than ever, looking to have flexible office space designs for their employees to promote collaboration as well as prepare for those coming back to the office, accounting for those on a hybrid schedule. As the table on the previous page depicts, more than 50% of occupiers now project over the next two years they will need flexible office space today versus only 35% from just last year. This will require tenants to provide employees more meeting and collaboration space which generally gives employees more choices of where to work….in the office!
Lastly, as mentioned in past quarters, we look to invest in efficient rectangular floor plates, high finished ceilings equal to or greater than 9’ along with “deck to deck” or “slab to slab” floors that are a minimum 12.5’ in height. The primary reason is flexible and efficient tenant space planning (low common area cost) and the ability to move fresh and recycled air through tenant spaces easily and at optimal volumes. This is extremely relevant in a post-COVID world. Older, vintage buildings, typically those developed in the 1980’s and prior, have low ceiling heights, less than 9’, and design architects clearly had a stronger voice than buildings developed since the late 1990’s as the older buildings are less efficient or obsolete. A recent study by Cushman & Wakefield analyzed the impacts of having healthy buildings, such as a LEED Certification (April 2022 by Patricia Kirk click here). The data was clear that in buildings analyzed with LEED Certification (providing tenants a cleaner environment and sustainable spaces), investors are willing to pay more for the asset, and tenants pay higher rents. These buildings typically lease faster and retain tenants due to their sustainability. The message is clear; tenants and investors want to see this in any investment. In response, the Griffin Partners TEAM has undertaken the initiatives to review our portfolio’s overall “building health.” As we learned how to implement and maintain LEED and Energy Star certifications within our portfolio, our Property Management TEAM went through a thorough process to achieve a WELL Health Safety Rating for almost all our office buildings under the WELL Health- Safety program. Our Property Management team completed an extensive review process for the majority of our portfolio of existing assets and worked with the WELL Building Standard team to employ seven key concepts to qualify for the WELL Health-Safety designation. These concepts include Air, Water, Nourishment, Light, Fitness, Comfort and Mind. We are proud to announce that most of office portfolio of assets now has this WELL-Health designation and a few of our recent acquisitions are going through the same rating process now. Please keep an eye out as you will see this logo as you enter most Griffin Partners office buildings..
Macro-Economic Conditions
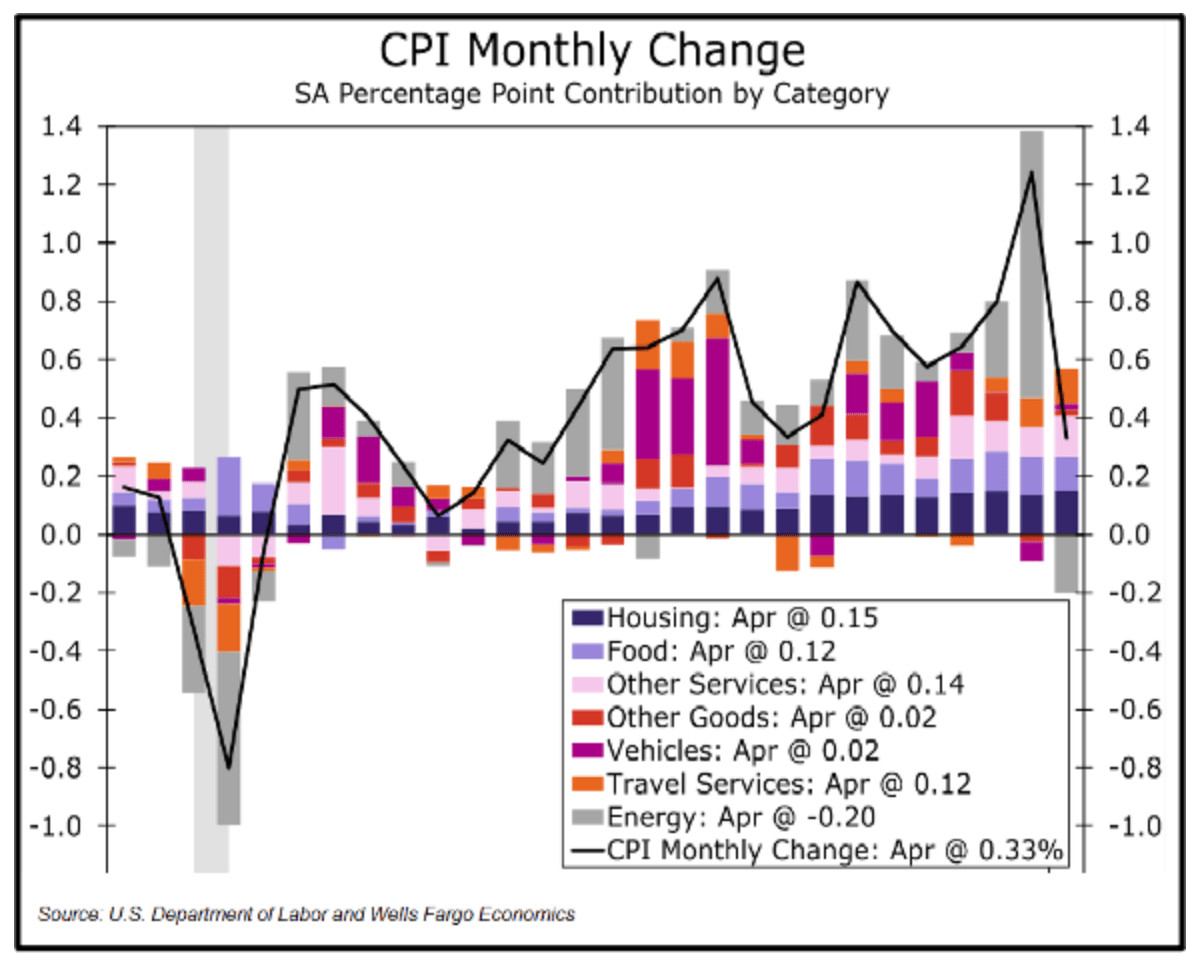
We will be the first to admit when we are wrong, and we have been proven wrong, at least in the near-term, on inflation, and consequently, interest rates. We underestimated the pernicious intensity of inflation and projected peak interest rates a bit too low, especially on the short end of the curve. In our defense, we did say at the end of our message last quarter: “One wild card to our forecast is the price of oil. If the (Ukraine) war results in an extended period (6+ months) of oil prices much above $115 per barrel, then inflation will remain elevated, interest rates will peak at higher levels, and the next recession will arrive sooner.” We are now three months into the war, and oil (WTI) has spent most of that time above $110 per barrel and is hovering at $115 as we go to press. It appears the U.S. economy is headed toward fulfilling the last part of our quote above. Undoubtedly, energy costs have been a major
contributor to inflation recently as can be seen in the nearby chart.
But the underlying issues are deeper than just the oil price. We underestimated the rising friction in the economy. The friction is coming from several sources, but likely the two most broad and durable sources are de-globalization and “green inflation.” To quote David Hay, of Evergreen GaveKal: “I’ve been long …. writing about green inflation. The idea that this green energy transition is inherently inflationary because for the first time in human history, we’re going from a more efficient form of energy to a less efficient form of energy. And, that in itself is inflationary. And we’re seeing that play out graphically in Europe and actually it became apparent last fall…” Many pundits are trying to discern empirical evidence of de-globalization and its impact on inflation, but definitive analysis is hard to come by. Some are confident lower transportation costs and rising automation (robots) will offset the higher labor costs from re-shoring production back into higher labor cost markets. Perhaps it is just difficult to see clear evidence either way. Despite arguments by some that re-shoring is not actually occurring, there appears to be plenty of evidence it is. For example, Samsung and Intel have both announced huge new semiconductor fabrication plants in Texas and Ohio, respectively. Of course, those fabs are highly automated. It does seem logical that larger inventories from prioritizing resiliency vs. efficiency, and higher labor costs should raise final product costs. However, in aggregate, those higher costs don’t have to be passed on to end users if we move from the recent era of higher corporate profits back towards the lower margins that prevailed over the 2nd half of the previous century.
We also suggested last quarter that the odds are decent the Fed may prove more timid in its rate hike regimen than the rhetoric and market pricing would indicate. In fact, over the past week, markets have priced in a lower peak for the (short-term) Fed Funds rate, and the UST-10 has fallen from a recent peak of 3.10% to around 2.75%. What is the market anticipating now that it wasn’t three weeks ago?
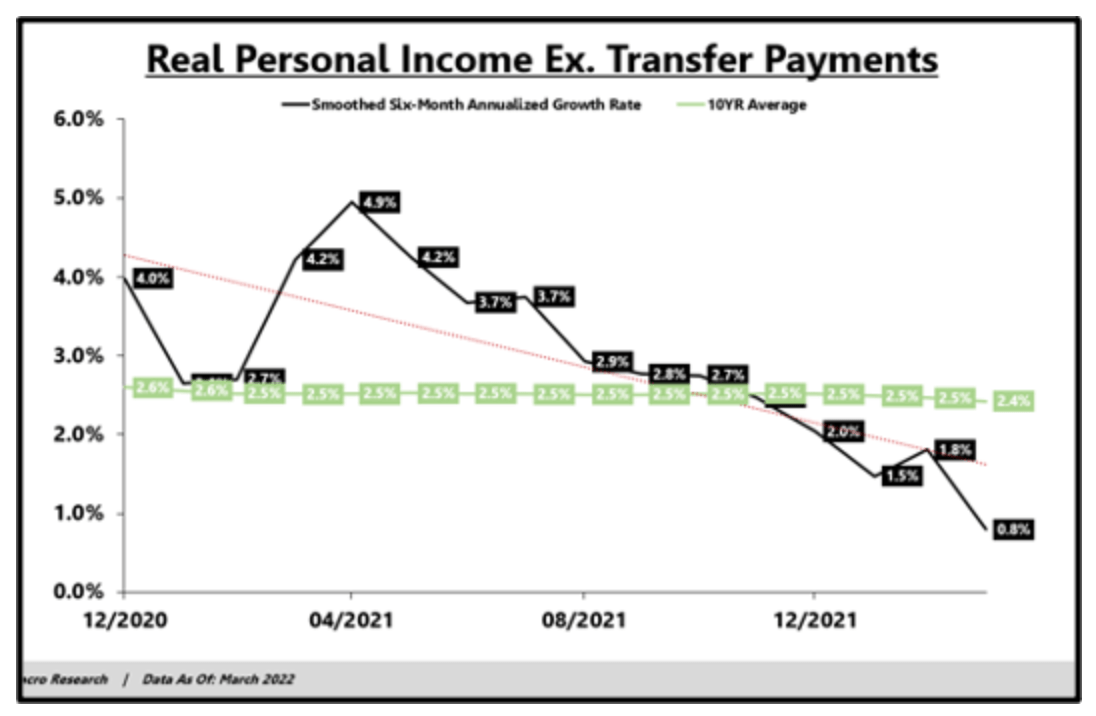
Employment growth has remained robust. However, the growth rate of real personal income is declining rapidly. EPB Macro Research: “Real personal income growth (excluding transfer payments) declined to just 0.8% in March, well below the long-term average of 2.4%. Since 1960, there have been eight periods of sustained negative real income growth, and seven were associated with recessions.” EPB’s chart can be found nearby.
A growing number of economists see a substantially higher risk of recession now as compared to three months ago. The two counter-recession facts pointed to by analysts most often are the tight labor market and flush consumer balance sheets. Unemployment is indeed near historic lows, but there may still be some slack in the labor market. COVID and changing patterns of employment may be distorting the normal measurement methodology.
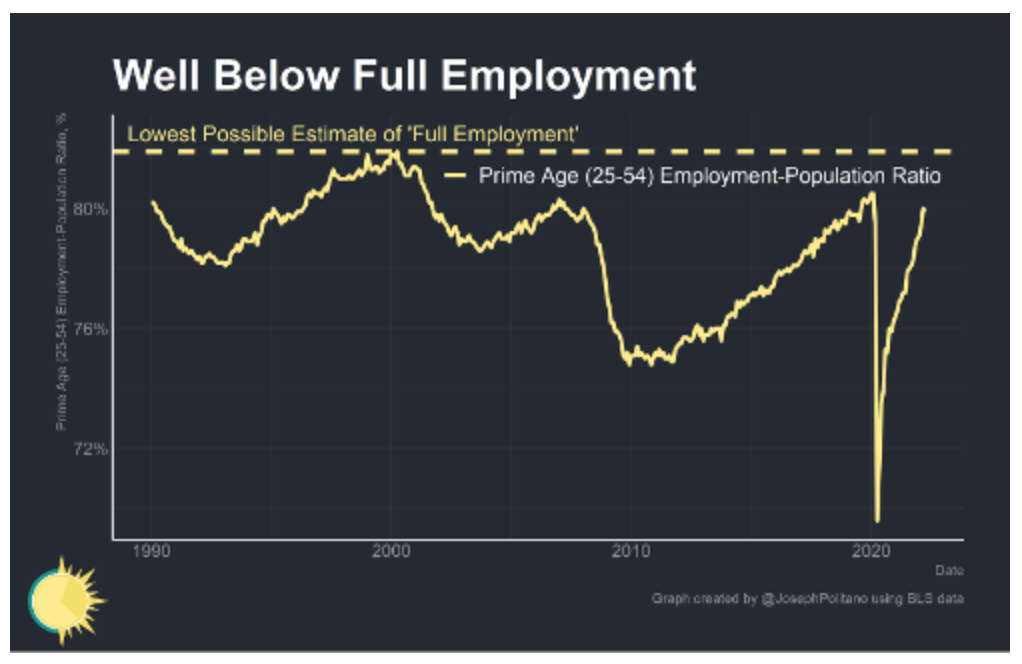
For example, if someone is not looking for a job, but then takes a job, technically the rate is little changed as the much larger denominator in the equation goes up but the numerator does not go down since the person was not counted as unemployed prior to taking the job. So, there was slack in the market that was not captured by the standard measurement. A better measure may be the employment to population ratio, particularly of the prime working age population. The nearby chart shows that the U.S is far from reaching pre-COVID levels, let alone the most recent prior peak just before the 2001 recession.
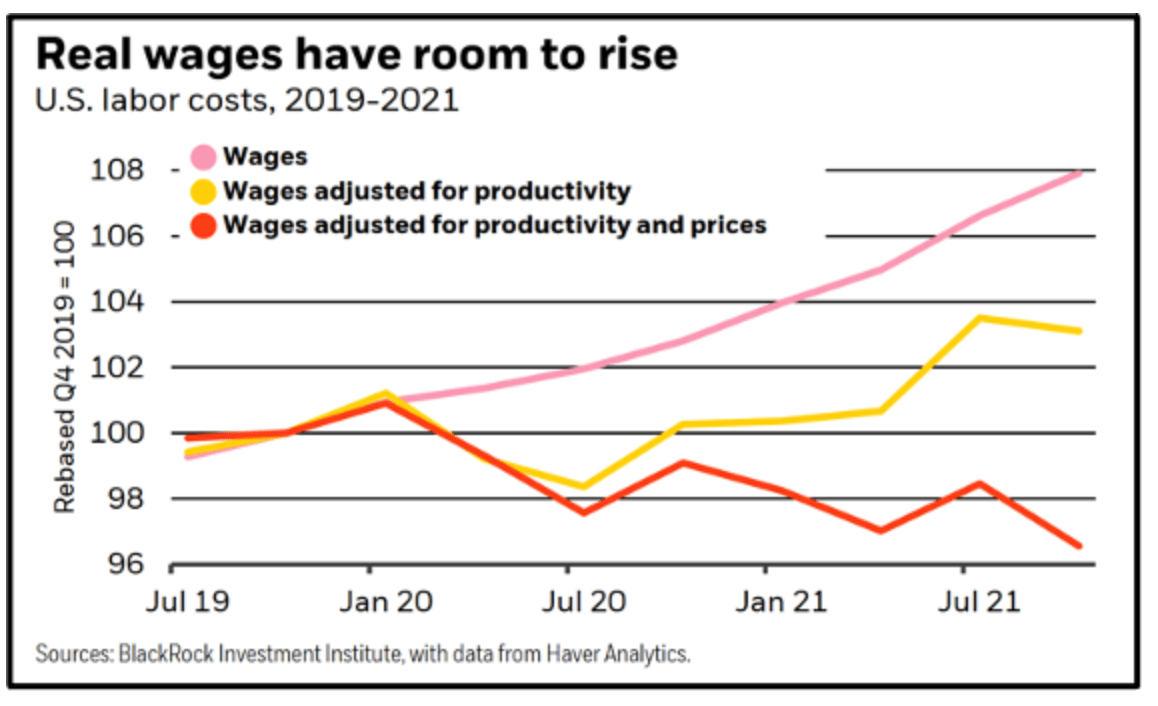
But aren’t wage pressures an indication of an overheated labor market and the potential for a “wage-price spiral?? Well maybe. There is a recent interesting study by BlackRock on this subject. In the piece, BlackRock says: “U.S. wages are growing at the fastest clip since the 1980s. Is this the start of a “wage-price spiral” – a vicious cycle of companies funding higher pay by raising prices, causing employees to ask for even higher wages? We don’t think so. In reality, we find companies are paying less in labor costs per unit of output than before the pandemic thanks to higher productivity and prices. We believe wages can rise further without adding to inflation – and help normalize the labor market.” BlackRock’s chart is nearby and indicates that maybe we can see wages rise further with a muted effect on inflation and profit margins.
Consumers definitely have more cash, at least for the moment. Wells Fargo has a chart which illustrates the bounty quite clearly.
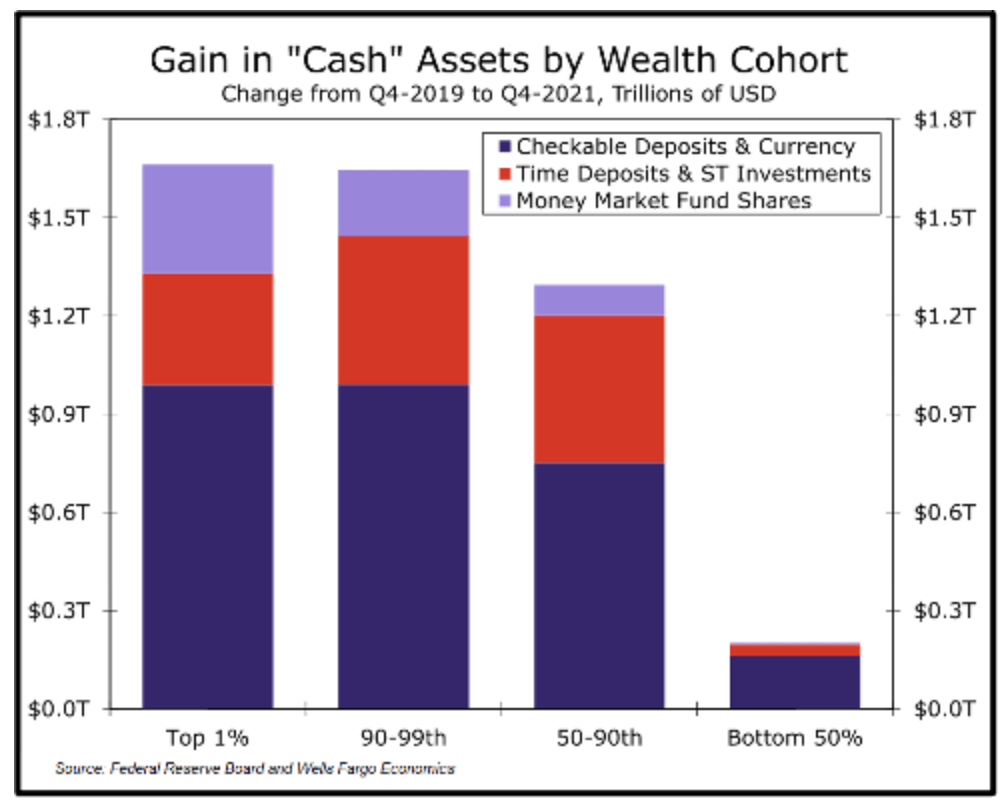
A meaningful amount of this cash came from federal government borrowings being transferred through various programs to individuals. Several trillion dollars as the chart indicates. The chart is as of December 2021, and no doubt a chunk of this cash has been spent in the first 4.5 months of this year. Our readers know we are not big fans of Keyneysian economic theories, but apparently massive amounts of government stimulous does have an impact on aggregate demand, especially when financed by the cntral bank.
However, as the stimulous wanes and monetarty policy tightens, the growth rates will decline, perhaps percipitously. The Q1-2022 negative GDP print might not be as much of an aberation as many are thinking. Quoting EPB again: “The early cyclical indicators of real growth, starting with monetary policy, strongly imply that worsening growth metrics are coming over the next 3-6 months. There is no significant force that will stop the economy from cycling downward, starting from a deterioration in real income. The question of a recession will be determined by the labor market and, most specifically, the cyclical pockets of employment. If employment growth remains strongly above trend, recession risk will be reduced, and the Fed will have even more room to tighten policy. But most evidence firmly suggests that aggregate growth will continue to decline, and if employment growth starts to follow downward, recession risk will be live. This is the most likely economic trajectory for the next couple of quarters.”
