Once this quarterly report is published the Fund III acquisition team will have less than 9 months to invest the remaining committed capital. We are up for the task and have plenty of assets to review for potential investment between now and March 2020….time flies when you’re having fun! On that note, we are pleased to report we’ve made significant headway over the last 12 months, and in this past quarter two new investments were placed under contract in two new target markets (Charlotte and Salt Lake City). We are on a good investment pace and assuming these latest investments close we will have invested Fund III capital across six of our ten cities which include Charlotte, Denver, Houston, Raleigh, Salt Lake City and San Antonio.
As discussed in our last quarterly report we are operating under a “cautiously optimistic” mode. While we have a strong appetite to invest, we continue to remain disciplined. The most important items we focus on in this cautious environment are average lease duration (weighted average lease term or “WALT”) and significant discounts to replacement cost, or “low basis” coupled with strong tenant credit quality. Further, as always, we continue to have a keen focus on historical occupancy and peak-to-peak rent growth to protect our downside. As can be seen in our long-term track record, we place supreme priority on capital preservation.
Fund Updates
Fund II: Our Asset and Property Management TEAMS are currently completing two remaining repositioning and lease up strategies for both Chandler City Center in Phoenix and Carolina Place in Raleigh. Both assets are receiving lobby renovations and  various building common area updates to facilitate the leasing of either existing or impending vacancies. A quick glimpse of the new lobby at Chandler City Center is nearby. This renovated lobby has been well received as evidenced by an immediate uptick in new leasing activity.
The lobby renovation plan at Carolina Place is in the early stages. This renovation is part of our strategic plan with an anticipated full floor tenant vacating in second quarter of 2020. With these planned upgrades we are confident the anticipated full floor vacancy will be successfully backfilled in a timely manner, particularly given the continued strong absorption in the Raleigh market and the outperformance to date of our underwritten rental rates. The Raleigh office market continues to thrive with reasonable levels of new supply and demand levels at close to all- time highs. We will provide a more detailed update later this year once the Carolina Place lobby renovation is complete.
Fund III: The North West Rubber (“NWR”) build-to-suit is in full swing and at this point on time and on budget! This light manufacturing building, once complete, will total 67,200 square feet and NWR will lease the building for a fifteen-year term. See the April photo on this page from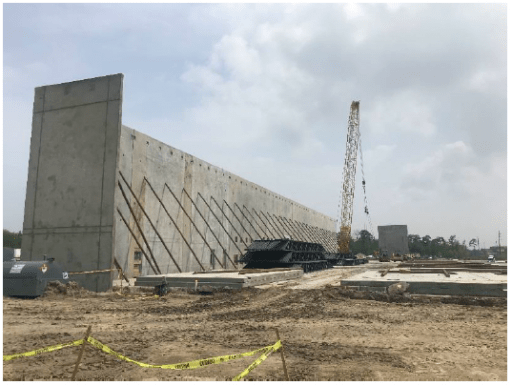 our Development TEAM. On the disposition front, we are marketing for sale our first Fund III acquisition, Arapahoe Business Park and 345 Inverness in Denver, CO, using the Denver investment sales team of CBRE. These two industrial-flex assets were purchased in May 2016, shortly after Fund III’s first closing. If the sale is successful, the hold period for these investments will have been shorter than originally anticipated. As mentioned in our last quarterly report, industrial assets are “the darling of the investment sector.” This overall sentiment of strong investor appetite for industrial assets was one of the factors considered when it was decided to bring these assets to market. Other decision factors included strong credit tenancy and in particular good WALT of 4.0+ years. We hope to harvest gains in-line with our underwritten returns as these assets have performed as planned. As part of our investment strategy Fund III purchased Arapahoe Business Park and 345 Inverness simultaneously at what we believed was a slight discount due to the sheer size of the transaction. From the outset we separated each asset within its own legal entity (separate tax parcels, etc..) with the strategy of breaking into individual asset sales to garner more interest to appease various industrial investor groups. By selling separately, we hope to provide greater exposure to the market, generate larger bidding pools and thereby maximize our investment results.
As indicated in the opening paragraph, Fund III is entering two new markets, Charlotte, North Carolina and Salt Lake City, Utah. These two transactions are in escrow with firm contracts and are expected to close in the coming weeks. The Charlotte acquisition consists of a three (3) building portfolio that includes BECO Plaza, Airport Overlook, and Scarlet Oak (the “Properties”) totaling 198,223 square feet. The Properties are under contract at a compelling and competitive basis in relation to the portfolio’s competition. The Properties are in the Airport submarket of Charlotte, the largest suburban office submarket, totaling 13.5 million square feet. This submarket has strong fundamentals with vacancy standing at 12.1% and rents growing nicely. Two of the buildings are midrise and one, Scarlet Oak, is a single-story office/industrial flex building. The Properties are currently 85% leased.
The Salt Lake City acquisition, Union Woods (the “Project”), is a six (6) story office building, built in 1985, and totals 98,739 square feet within the Union Park Submarket just south of Hwy 215. The Project has been completely redeveloped in 2017/2018 by the existing ownership. Union Woods is a leader in rental rates for this vintage product. Upon closing, the Project will be 91% leased with an average weighted lease term of 3.5 years and in-place gross rents of approximately $24psf (15%+/- below recently achieved starting rental rates).
These two transactions represent what we continue to look for through our remaining investment period; either a low price per square foot (basis) and/or a strong weighted average lease term of 3.5 to 4 years at a minimum.
Real Estate Market Conditions
More of the same for the U.S. macro office and industrial market conditions. That is the general sentiment across all commercial real estate (CRE) reporting services. Fundamentals are steady as of first quarter 2019 and will see more of the same from now till late 2020. As mentioned in our last update, many are thinking we are at an “economic inflection point” for slower than normal growth and slower growth for the real estate markets in general. REIS put this in context in their latest Q1-2019 report with their opening salvo “Mostly a lot of Flatness” titling the report. The U.S. expansion is projected to continue, and the real estate sector will continue to be a beneficiary of this continued slow and steady growth.
Sales volumes as of Q1-2019 “….have declined comparative to Q1-2018, as entity level volumes have slowed to the lowest level in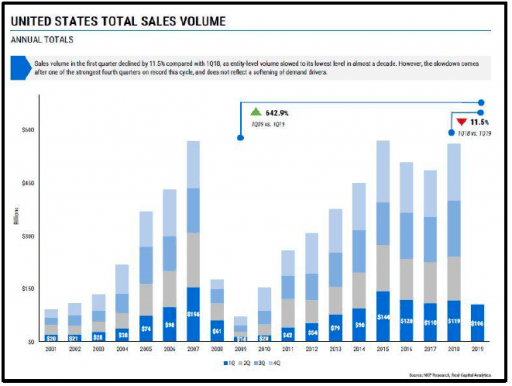 almost a decade. However, the slowdown comes after one of the strongest fourth quarters on record THIS cycle, and it does not reflect a softening of overall demand drivers for real estate…”, per NKF Research, RCA 1Q19. As summarized in the attached table the last time we reached over a $100 billion in quarterly sales was inthe last cycle peak ofQ1-2007. Sales volume has been on a tremendous clip since 2015 with each quarter since that time eclipsing $100 billion. So, what does all this mean? Large institutional investors have been busy pouring capital into the primary markets driving down cap rates in the last 5+ years (see chart on next page). Our investors know we have long held the thesis that capital flows in search of better yields would migrate from primary to secondary markets. We have seen this in spades over the last couple of years as institutional investors have set their sights (a herd mentality) on secondary and tertiary markets. Now we are seeing dramatic evidence of this shift in capital not only from domestic but also international capital over the last year. Per NKF, international capital flows have pushed hard into secondary and tertiary markets with just over 50.6% of the total trades in secondary and tertiary markets and less than 50% (49.4%) into primary markets. Five years ago, primary markets received 70% of all international capital investment, this is a stark change in capital flows.
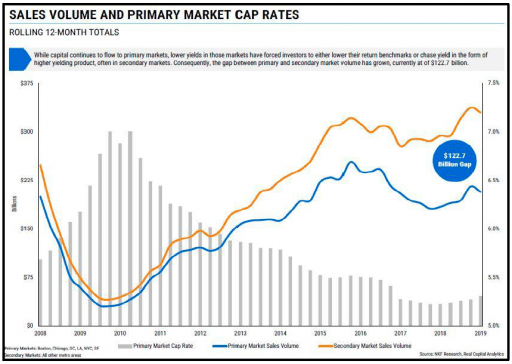
As expected, eventually, international capital with follow domestic capital, and as you can see below sales volume (capital) has been ratcheting up since 2014 in secondary and tertiary markets, while capital flows into primary markets have remained strong but muted in comparison. The sales volume gap between primary and secondary markets has grown to over $122.7 billion and primary market cap rates have fallen from around a 6%+/- cap rate to mid to low 5% cap rate range since 2014, hence the strong push by institutional capital into secondary and tertiary markets for better yields.
Capital shifts into markets we invest is not new news, and it’s actually what plan for over any given cycle. As evidence of our capital flow thesis can now be well observed for a sustained period, we have shifted our investment philosophy slightly to emphasize low basis and weighted average lease term as market fundamentals near or in some cases surpass equilibrium and pricing starts to peak. While we haven’t abandoned looking for value add opportunities, we are simply more selective than usual to find those opportunities that fit our specific profiles and provide better downside protections for our investors. The push by large institutional investors into the secondary markets and their craving for “Value-Add” or “Opportunistic” investments is largely a function of massive amount of capital waiting in the wings to be invested (e.g. “Dry Powder”), a trend we have highlighted in past reports. Per the NKF Research and Real Capital Analytics table on the following page, $212 billion is sitting on the side lines waiting to be invested as of 1Q2019. 67% of this capital is tagged for opportunistic or value-add strategies with only 6.6% allocated for “Core & Core Plus” strategies. In comparison, $134 billion was on the side lines or uninvested, and 11.9% of that institutional capital was allocated for Core & Core Plus in 2015, effectively half in comparison to today. So, on that note, from what we can tell the tide is out on secondary core to core plus investments and as a counter cyclical bet we’ve continued to focus what the majority of institutional tide is shying away from. Hence our slight shift in investment targets with longer WALT, strong basis and strong downside protections.
We’ve witnessed first-hand these new capital flows into our target markets with new investors (first time entrants) bidding on 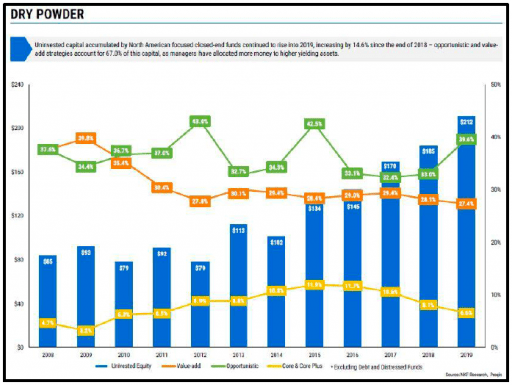 projects as well as chatter from large investors who contact our team in search of our opinion and data on market fundamentals with the intention of investing in our markets.
National Real Estate Investor a publication we follow with interest particularly for its insight into CRE capital market conditions, indicated the rising levels of foreign investment during the past few quarters “is driving investors to secondary markets.” These capital flows have both positive and negative impacts on our target markets. They create highly competitive offering processes (a boon for our existing assets if we are positioned to sell), but they can also force pricing to a level at which we can’t compete to acquire new assets. We try to shy away from bidding wars an sale processes where the assets are “priced to perfection”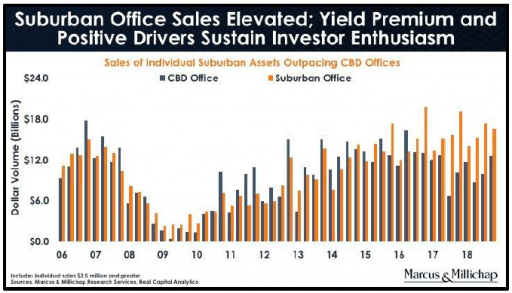 and risks are not properly discounted. Investors’ positive outlook and appetite for secondary markets is no surprise to us at this point as they are recognizing robust growth in high-value job sectors, such as technology, financials services, and health care in places such as Raleigh, Charlotte, Denver and Austin. Further, as our target markets continue to add new supply at a reasonable rate, with some exceptions, we expect to see favorable real estate conditions with falling vacancies and rising rents, albeit at a pace a bit slower than cycle peak. Even though rental rate growth is past its peak, the continued population and job growth coupled with limited new supply across most secondary markets, is resulting in rental rates growing faster in secondary markets versus primary markets, by a factor of two (3.0% growth in secondary versus 1.4% in primary markets according to CoStar 1Q2019). These various attributes underscore our conviction to continue investing appropriately in our target markets.
Macro-Economic Conditions
“Sell in May and go away” is a somewhat infamous saying about the behavior of stock markets during the summer, or maybe it is more about the behavior of the Wall Street types who spend the summer out in the Hamptons…. Perhaps the saying should have an appended phrase this year: “…and buy bonds!” Certainly, stocks have swooned in May and money has moved into bonds forcing interest rates down to multi-year lows for the intermediate and longer end of the yield curve. Our readers know we have been predicting lower interest rates for some time, but even we are surprised by the magnitude of the recent decline the in the 10-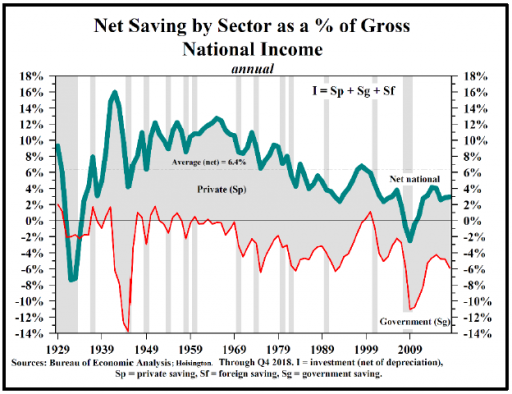 year and 30-year US treasury rates. The Federal Reserve is expressing “patience” in their post meeting policy statements and in the rhetoric from FOMC members heard during the speeches they make, but the patience seems more like indecision and an internal disagreement over the likely winner of tug of war between persistently low inflation and currently very low unemployment. One might even say that current conditions do not correspond with the Fed’s general belief in the primacy of the Philips Curve, and as a result the FOMC members are paralyzed! No gloating, but you know from past musings that we are skeptics of the Philips Curve, or at least its application to and usefulness under modern global economic conditions.
So, will interest rates stay low? We have not changed our opinion on that question for quite some time and think the answer is emphatically yes. To be sure, there are some positive signs of solid economic growth. Us Q1 GDP above growing above 3% was a surprise to many, and definitely good news. With a low print aberration in February being an exception, monthly job gains in the US remain solid, consistent with the figures since early 2017, albeit slightly lower on a trailing six-month average. However, while commenting on the April (most recent) jobs report, Peter Boockvar said: “While it looks strong on the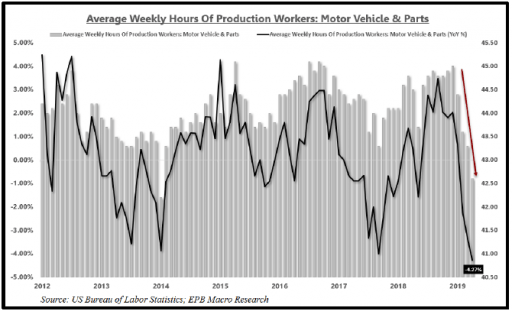 surface, this jobs report is still consistent with a gradually weakening economy. Low wage growth and labor force shrinkage are both negative signs. It doesn’t point to imminent recession but is far from an all-clear signal.” Another positive indicator in the US is the uptick in consumption in February and March (latest available); however, the increase outstripped gains in income resulting in a hit to savings. In the long run, below trend savings is not good for the economy, extending debt and lowering investment and therefore productivity. Therefore, the clear downward trend in savings that can be seen in the graph on the previous page is troubling. BTW – classical economics teaches that government deficits are negative savings………just sayin’!
Another conclusion from the April jobs report is the confirmation of the dramatically weakening conditions in the auto sector. Declining demand in the broader economy most often stem from sectors where previously pent up demand has been met and often surpassed by increased production capacity. That condition most likely describes the current condition of the auto sector. 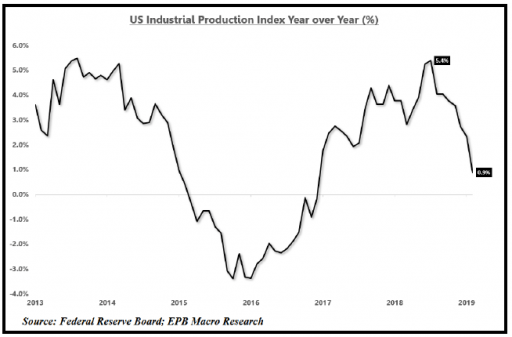 An economist we follow closely, Eric Basmajian, has taken the details from the April jobs data and stripped out overtime hours from the motor vehicle sector, which results in clear evidence of a 4% decline in full-time hours and a “precipitous decline in nominal hours worked.” See the nearby chat. Eric believes data on hours worked “leads broader employment because it is less binding and less costly to reduce hours worked than to layoff and rehire new employees when there is a shift in demand. {And} If hours worked decline and demand does not rebound, the only next step is to lay off workers.” There were fewer motor vehicle industry employees working in the US in April than in the same month during 2018, a situation that has only occurred for one month in hours late 2016 during this recovery. We have also seen a few news stories about domestic auto layoffs, not in droves, but the direction is clear.
The auto industry is not the only segment of domestic manufacturing that is slowing. The industrial production index (IPI) is a monthly economic indicator measuring real output in the manufacturing, mining, electric and gas industries, and while it is a relatively small part of GDP, it can be a harbinger of macro trends in the overall economy, especially when trends in the IPI are sustained over several months or quarters. The chart of the IPI at the bottom of the previous page looks similar to the auto hours worked chart, falling from a peak year-over-year rate of change of 5.4% in the fall of 2018 to under 1% for the most recent measure in April.
We are chart geeks, and we have shown you the next chart before, but it has been a while. It is an interesting chart because it encompasses many themes including the secular transition of mature economies away from manufacturing, the rising efficiency of manufacturing (both generally good) as well as the migration over several decades of more manufacturing offshore. 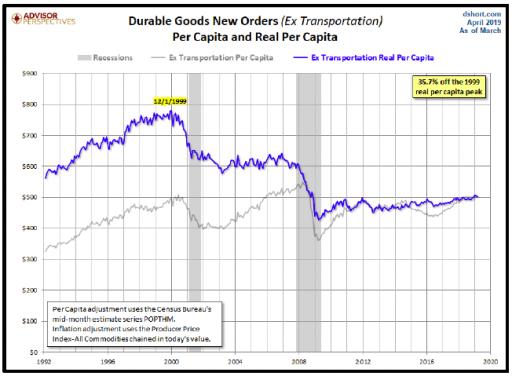 Durable goods orders is a leading economic indicator. Nominally, U.S. Census Bureau, Manufacturers’ New Orders: Durable Goods index has been trending down from a noticeable peak in September 2018, which was the current cycle peak save for an outliner month distorted by huge aircraft orders in July 2014, and which was also nominally 8% higher than the prior peak in 2008, just before the great recession. However, when adjusted for population growth and inflation, plus removal of the volatile aircraft orders, the index tells a different story. Those adjustments reveal a data set that illustrates significant shifts in production and demand within the domestic economy. As you can see in the chart from Advisor Perspectives, “the real per-capita demand for durable goods has increased since the trough at the end of the last recession. But new orders remain far below their respective peaks near the turn of the century.” Advisor Perspectives goes on the postulate that “a key driver, or lack thereof, for healthy growth in durable goods orders is {lack of} growth in {real} household incomes.”
Sticking with the data emanating from the excellent chartists at Advisor Perspectives, it appears that only recently have household incomes begun to rise on a real basis during this cycle, and the history of real household incomes in the 21st Century is pretty dismal, with a brief period of growth immediately prior to the great recession, but essentially very little growth since the year 2000. See chart on next page.
What might be the drivers of this clear slowdown in the hard goods side of the economy? Trade tensions certainly are having an impact, although the direct impact of tariffs is hard to calculate. Uncertainty surrounding future trade policy no doubt has a 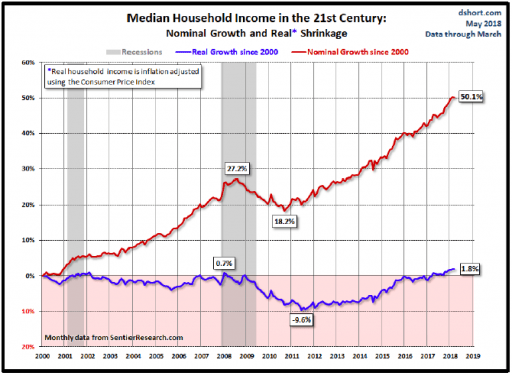 chilling effect on business planning and decision making. Another potential cause is Fed policy of tightening monetary conditions. Some folks like to point out that rates have not risen that much, at least by historical standards. However, it is important to remember that the we are in the process of exiting a set of conditions that do not have a historical precedent when the massive expansion of the Fed’s balance sheet is considered. Using “shadow rates” calculated by the Atlanta Fed, Sam Rines of Avalon Advisors (hometown Houston boy!) calculates the combined Fed tightening policies of raising the Fed funds rate and shrinking the Fed’s balance sheet “equate to a 5.5% increase in the fed funds rate. That amount of tightening is the most the U.S. has seen post the early 80’s breaking of inflation.” Hmmm………We haven’t seen much discussion of that number in the mainstream financial press. The Fed has recently backed off, indicating it will be “patient” regarding future changes in the Fed funds rate, and signaling that the balance sheet run off will likely end later this fall. But monetary policy has a significant lag time, so changes in Fed policy now won’t likely be absorbed in to the domestic and global economies (yes, the Fed has a big impact on global financial conditions) for several quarters, plenty of time for a mild recession to take hold. As we pointed out in a very illustrative chart last quarter (page 14), the terminal (highest rate) in a Fed rate hiking cycle has been successively lower for each cycle going back to the aforementioned breaking of inflation in the 1980’s.
It is our opinion that short term interest rates have peaked for this cycle and will likely be lower a year from now. We are still underwriting conservatively and assuming another 25 basis point increase in LIBOR, but nothing beyond that. And we have shifted our hedge strategy from purchasing interest rate caps, to entering into costless collars because we don’t think the dollars spent to buy an interest rate cap are worthwhile. If current trends continue, we will soon be simply floating our interest rates when lenders allow.
Since we have swerved into our investment strategy again, we will take a quick look at another thing we are keeping an eye on when assessing our target markets. One of the consequences of state and local policies designed to counteract the lack of real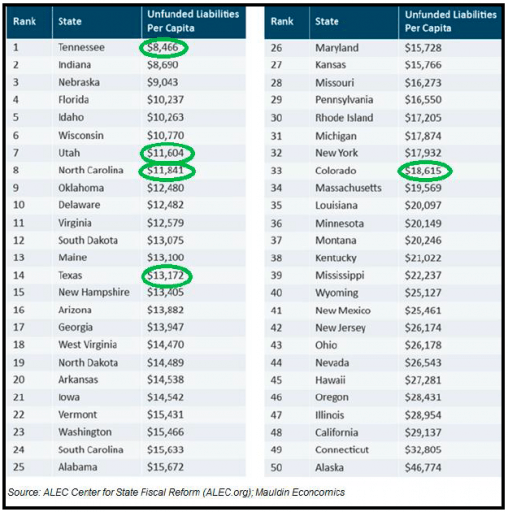 growth in household income discussed above is the rapid expansion of pension and health care benefits for public employees. Unfortunately, governments are muc better at agreeing to benefits than they are at paying for them, and the result is a large and growing problem of unfunded liabilities. We will save a discussion of the massive unfunded liabilities at the federal level for another day, largely because their burden is harder to avoid through taxpayer mobility. Not so at the state level. A state that jacks up taxes to address its unfunded liabilities could see an exodus of taxpayers. So which states have the highest unfunded liability burden? Look at our last chart, which we have marked to highlight our target market states.