Many interesting things have happened in the broader world as well as in our little corner since we last wrote. The US 10 year Treasury peaked briefly above 3%, proving our powers of prognostication to be rather pedestrian. A wager or two was lost as a consequence of that cyclical milestone, but it may be tempting to double down at a slightly higher threshold, given the recent retreat in long term rates. The team has recently completed a small sale, a large purchase, has another sale teed up and a purchase under contract. Plus, our acquisition pipeline is full with more opportunities to investigate than we have seen in quite some time, which is interesting given the moderation of pricing in the overall commercial real estate (CRE) market. More discussion on that below.
Fund Updates
Fund II completed the disposition of One Harrison Park in the Raleigh-Durham market in North Carolina, for which a contract was being negotiated as of our last quarterly writing. The transaction is the seventh realization of eleven total investments made by Fund II. The investment returns to Fund II on One Harrison were excellent. We are certainly pleased with the results of this investment as they exceeded our original underwritten expectations. Our only wish was that the property had been larger! More details about the individual investment results can be found in the Manager’s Letter which follows.
With the distribution of sale proceeds from One Harrison made last month, Fund II has now returned 117% of investors’ contributed capital. Fund II investors have received all of their money back plus an 17% profit within two years and five months of making the final capital contribution in December 2015 and still own interests in four assets.
At the end of March, Fund III completed the acquisition Loop Central which had been under contract since last summer. We are quite excited to rapidly embark on the value-add business plan for this 575,000 square foot three building office asset in Houston.
Real Estate Market Conditions
We have observed and reported for a few quarters now on a moderation in CRE price gains. Evidence is starting to mount supporting our observations and can be seen in the pricing indices published by some of the firms tracking the industry. In April 2018, Green Street Advisors reported that CRE pricing as measured by the Green Street Commercial Property Price Index (CPPI) was essentially unchanged for the month, quarter and trailing year! The index, which measures CRE values across five major 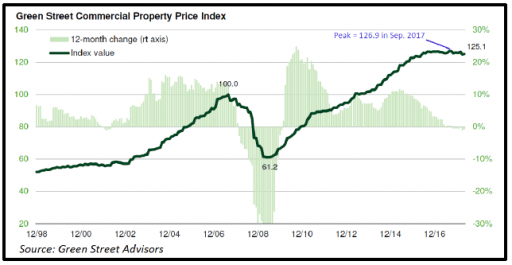 property sectors, has been moving sideways for almost two years (see chart) likely reflecting an increase in interest rates and a deceleration in rent growth. However, as we have previously pointed out in other indices, the aggregate is a bit misleading because prices in some sectors, namely industrial and multi-family apartments are significantly outperforming other sectors like retail which is actually down 10% from its peak. A table of the individual performance of the five sectors can be found below. The peak for Green Street’s aggregate index was 126.9 in September 2017, and the current level of 125.1 represents a 1.4% decline from that point. It is also worth noting that the index is set to 100 at the point of the previous cycle peak, and as such the current index of 125.1 means that aggregate pricing is 25% higher than the last cycle peak. While 25% is noteworthy, there are certainly some other major asset classes with much larger price gains over the present cycle.
Green Street’s CPPI is a time series of unleveraged US CRE values which captures the prices at which Class A, high quality transactions are currently being negotiated and contracted. Importantly, Green Street’s CPPI is appraisal-based while most other indices are transaction-based. Green Street, a premier adviser to REIT focused investment managers, conducts monthly appraisals of a large number of REIT owned properties and uses the resulting values to form its CPPI, published monthly.
In past reports, we have shown readers the pricing data and graphs from CoStar, which publishes its own paired transaction driven indices measuring price movements for CRE. A few months ago, CoStar was also showing indications of a slowing market 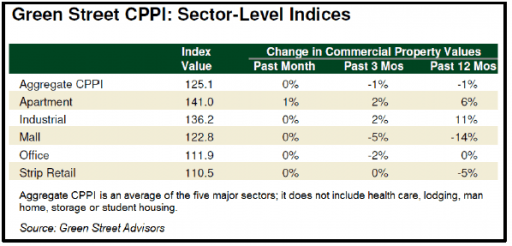 for larger-sized assets with a year over year gain of 6%, down from double digits gains seen in the first half of 2017; however, the April data seems to be indicating a slight reacceleration to a roughly 9% annual gain.
CoStar’s equal-weighted US Composite Index, which reflects the more numerous but lower-priced property sales typical of secondary and tertiary markets, actually declined by 1.4% in the month of April, but was still up by 8.6% in the 12-month period ended in April 2018.
Taken together, the different indices from these two firms in our view portend a rising air of caution, an observation we began conveying to readers a couple of quarters ago, and one which is appropriate and not unexpected after such a long cyclical upturn. Deals are still getting done and opportunities can be found across the CRE investment spectrum, but the circumstances certainly call for maximum discipline and diligence.
So what is happening with CRE fundamentals that could be contributing to the slowing price gains? Rent rate growth, with the possible exception of industrial properties, is definitely slowing. Savills Studley, a national tenant representation brokerage firm, produces an annual report that tracks Class A effective rent for 20 large CBD office markets. Effective rent takes into account concessions the landlord offers such as tenant improvements, free rent, free parking and other goodies. The firm’s 2018 Effective Rent Index indicates that rates continue to increase and concessions remain on the downswing in cities dominated by the tech industry, meanwhile markets dependent less on tech and more on traditional office users are experiencing the opposite. According to Savills Studley, landlords in some gateway markets with swelling inventories of new developments and repositioned properties have been offering “special deals in an effort to lease-up properties. However, the limited pool of premier offerings in tech hubs is having a converse effect, with concessions on the downswing and prices on the rise.”
“Talent and quality office space both come at a high price, even in many of the markets such as Atlanta and Dallas where developers used to be guilty of overbuilding nearly every cycle,” Keith DeCoster, director of U.S. Real Estate Analytics with Savills Studley, told Commercial Property Executive. Talent and space come at a high price………those words feel like a faint echo, reminding some of us old enough to remember of the tech bubble of the late 1990’s where copious amounts of money were raised and spent on people, space and buyouts many of which later proved to be of limited value…..at best.
Meanwhile, in non-tech markets concessions packages are creeping up and effective rents are therefore beginning to fall. In total, 12 of the 20 cities analyzed in the Savills Studley report logged an increase in concessions and a decrease in tenant effective rents. 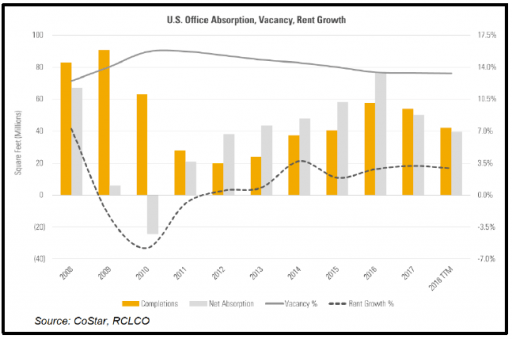 Bear in mind these are Class A rents in CBD markets only, and each asset and submarket we assess when looking at opportunities has different and independent conditions. Nonetheless, we have for some time now been moderating our rent growth assumptions in all of our underwritings. The 8 CBD markets where the report recorded increases in landlord effective rent included 3 of our target markets, namely Dallas, Austin and Phoenix. Houston was essentially flat, which is an improvement from where it had been over the prior two years.
The pace of construction remains about the same as last quarter. We won’t bore you with as many of the numbers from Dodge Data & Analytics as we did last quarter, but say only that overall construction activity nationally is running about 7% less in 2018 year to date, as compared to 2017, which remains consistent with the full year decline experienced in 2017 compared to 2016. The forward looking Dodge Momentum Index continues to show a solid acceleration, but those projects must still be in planning as the actual starts have yet to materialize.
The net result for office is that vacancies have been relatively flat since 2016, with net absorption being roughly equal to completions. 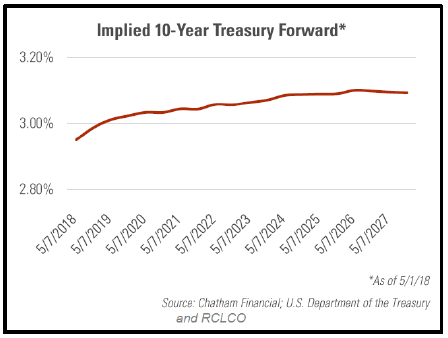 All of these trends can be seen to varying degree in the chart on the previous page which shows completions, net absorption, vacancies and rent growth for Class A and Class B office properties nationwide that are larger than 30,000 square feet and not owner-occupied. So with overall values drifting sideways or increasing slightly and fundamentals stable to slightly down in some markets, the only thing that appears to be a potential major shock to the CRE system is the prospect of a meaningful rise in interest rates and the potential impact that would have on cap rates. Certainly that prospect is top of mind for most CRE professionals. We share some opinions on interest rates in the economic section that follows, but regardless of our opinion, the financial markets do provide a real time forecast. The nearby chart derived from Treasury forward rates as of May 1st shows that the 10 year Treasury yield is not expected to rise much above 3.15% over the next ten years. However, subsequent to May 1st, the 10 year Treasury yield rose above 3%, peaking at 3.11% on May 17th before falling back down and remaining below 3% since May 22nd. So the implied 10
 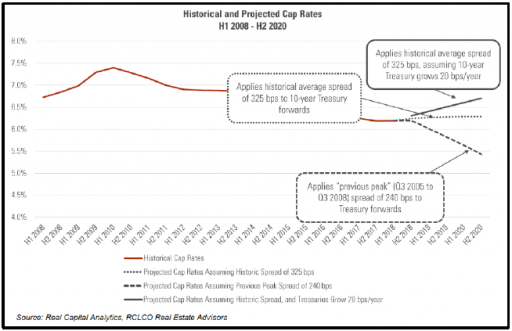 year Treasury forward has no doubt moved up a bit since this chart was made, but probably not much. One can then overlay varying assumptions about the spread between the 10 year Treasury and CRE cap rates. The next chart does just that, showing three potential outcomes for cap rates. The most likely applies the long term historical average spread of 325 basis points to the 10 year Treasury forward. The result is a relatively flat projection of cap rates for the next three years. Although the probabilities assigned to either of the tail outcomes are not immaterial, we do believe the highest probability outcome is flat to slightly higher cap rates until the next recession when interest rates will in all likelihood fall again.
It is worth noting that CRE prices can be affected by the short end of the interest rate curve as some borrowers float interest rates over short term benchmarks. And rising interest costs for floating rate CRE financing lower leveraged returns and thereby values that buyers are willing to pay. We typically fall into that category and have seen a compression in the spread between leveraged and unleveraged returns which push us towards slightly lower pricing in the offers we submit. As discussed in our report last quarter, we prefer floating rate financing hedged with an interest rate cap, which provides “insurance” against a large spike in interest rates, but if rates decline during our hold period we can benefit from that lower financing cost.
Macro-Econimic Conditions
The US economy appears to be humming along nicely and labor market conditions are quite favorable. There are however signs of slowing global growth outside the US, and most pundits do acknowledge a few clouds forming on the horizon, particularly the specter of rising tariffs and the adverse impact they could have on inflation, trade volumes and economic efficiency. The growth of retail sales remained healthy in April, with the control group used to calculate GDP posting a 3.9% year over year gain, which is above the average for the last several years but notably down over the past few months (see chart and insert). The more volatile three-month average was up only 1.7%, 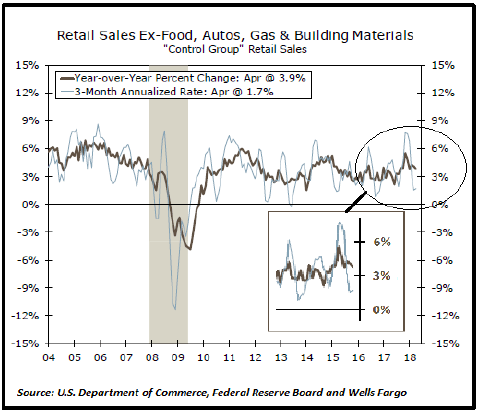 which may be more indicative of the current trend as consumers have pulled back a bit after a robust holiday season. Capital spending remains elevated although not as vigorous as the cycle highs seen at the end of 2017, and industrial production has remained strong recently with growth spread evenly across industry groups. Housing is experiencing some headwinds from rising interest rates but builders continue to be very optimistic about future activity. Durable goods orders have been mixed with the headline (total) number falling slightly in April but the core number, which exclude defense and aircraft orders, rising almost 1% month over month. The ISM Purchasing Managers Index (PMI) ticked back up in May to 58.7, off of the cycle high peaks of 60.8 hit in September / October 2017 and February 2018, but very healthy nonetheless. The year to date PMI performance bodes well for strong output through Q2 and Q3.
Some of the clouds forming on the horizon however could develop into fairly unpleasant storms. Outside of the US there are signs of deceleration and slower growth in most large, developed economies. The first quarter numbers for the UK and the Eurozone came in at a markedly slower pace than the prior quarter, and real GDP actually contracted at an annualized rate of -0.6% in Japan in Q1, the first negative print in the sequential rate of real growth for Japan in the last nine quarters. The economists at Wells Fargo expect Japanese growth will resume in coming quarters, but the contraction in Q1 is notable regardless. Meanwhile, growth in China remained stable in Q1 at around 6.8%, but there are signals, in particular a continuing trend of meaningful deceleration in Chinese investment spending, which suggest that growth may be slowing some during Q2 and beyond.
We expended considerable ink last quarter on inflation trends, and this quarter we will look more closely at the relationship between inflation and interest rates across the yield curve. A quick glance at the core readings for CPI and PCE in the chart nearby 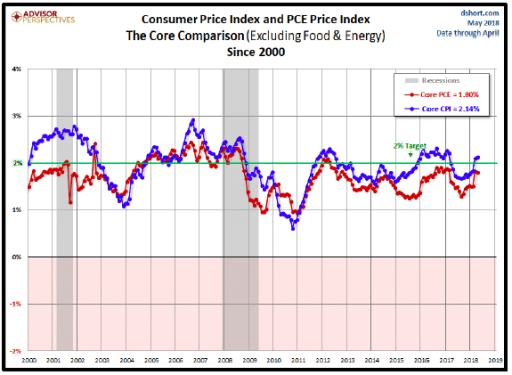 shows that inflation is indeed ticking up in early 2018. It is interesting to note though that while inflation has certainly been trending up, the Treasury yield curve is flattening, as short and intermediate term interest rates have moved up much more than longer term rates. This shift in the shape of the curve is a signal.
The flattening curve, driven primarily be the anchoring of longer term interest rates, can be a signal of two things, or possibly a combination of both. One is good, and one not so much. The first reason long term rates may be grounded is the bond market anticipating the impact of rapidly accelerating, disruptive innovation upending traditional economic metrics and ushering in an era of declining costs and rapid productivity growth. Over the last couple of years we have examined and reported on disappointing growth in productivity, but it could be possible that established measures of productivity are not picking up the impact and economic value of these disruptive innovations, which include among other things robotics, gene sequencing, artificial intelligence and connected devices (the internet of everything). Some people would throw blockchain into the group, but that is a subject for a future report. Intuitively, there is some merit to this perspective. How can traditional productivity measures, or traditional inflation measures for that matter, pick up the incredible changes wrought on our work and leisure habits by the powerful connected computers that we all now carry around in our pockets? Surely there is a utility value there that is not being captured by conventional statistics.
Advocates for this theory argue that the last time we had this much significant platform innovation was around the time Henry Ford was dreaming up the assembly line and the Bell Telephone Company was stringing the first set of wires between Boston and New York. 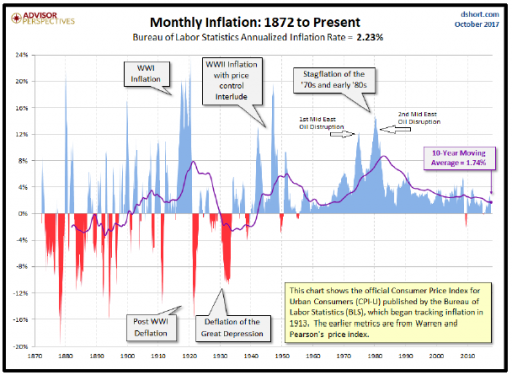 Importantly, if we look at the left hand side of the nearby chart showing the long-term history of inflation, it is evident that the 10 year average inflation rate was negative (deflation) for the last two decades of the 19th century, albeit with a high degree of short term volatility. According to the National Bureau of Economic Research, during much of that period the yield curve was inverted during periods of rapid growth because the short term cost of capital was high as rapid growth and investment consumed capital, yet the long term bond rates were low as investors had little fear of inflation.
The less benign reason the yield curve may be flattening is that investors believe that demographic headwinds, excessive debt levels (see more on that below) and stubbornly low productivity growth (by traditional measures) herald a return soon to slower growth and less inflation pressure. As an example of one element in this line of thinking, George Friedman, speaking at a NAIOP conference last winter said that the decline in productivity we are currently observing is a function of the maturation of the microchip industry at the “end of its 40 year innovation cycle.” We offered a fair amount of material on the slower growth scenario last quarter, so we won’t belabor it here if only to help all of us keep an open mind on the matter.
Where else can we look for clues? The corporate bond market at present appears to have bought into the better scenario of high growth and low inflation. Spreads between lowest tier investment grade corporate bonds (Moody’s Baa) and corresponding 10 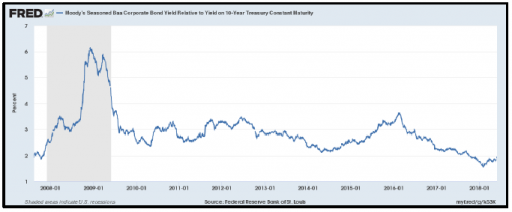 year Treasury bonds, while off the cycle lows seen this past February, remain very near those recent cycle lows and under 2.0%. See nearby chart. There is an argument that neither the credit nor liquidity risk in these securities is properly priced (more on that below), but for now investors in corporate bonds appear to be believers in the more optimistic reasons for the flat yield curve.
Inflation expectations also seem firmly grounded only slightly above 2%. While up from the depths plumbed in the second half of 2016, they have yet to return to where they were in August 2014 and for most of the recovery prior to that, with only a few brief 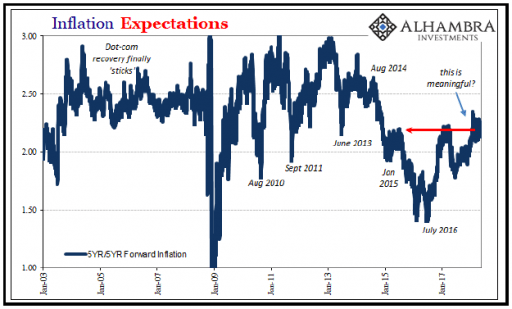 exceptions. The current level stikes us as a far cry from a signal that the economy is about to be overrun by a substantial inflationary surge driven by excessive labor shortages and the resulting wage gains. Recent monthly editions of the University of Michigan’s Surveys of Consumers also indicate placid figures for consumers’ inflation expectations. Data from the UofM survey has been range bound between 2.5% and 3.0% since 2015, except for a brief period in Q4 of 2016 when it dipped to 2.2%. That range over the last three years is 0.5% below the average for the prior four years, which represents most of the current recovery.
Since consumer inflation expectations are anchored, and wage gains so far are only slightly above recent intermediate term trends, it is likely that the small rise in inflation recently is largely a function of late cycle acceleration in commodity prices. 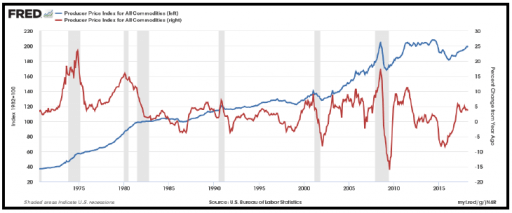 Oil and copper have recently pulled back somewhat, but prior to had generally been on an upward trajectory off of their 2016 lows. In the nearby chart of the Producer Price Index (PPI) for All Commodities it is evident that after five years of flat or declining commodity price growth, the index has been running at nearly twice the rate of inflation over the past year. These costs get passed through eventually. Several analysts have pointed out that the economic cycles typically experience a commodity price spike leading into most recessions. So is a recession eminent?
Many analysts and economists produce a wide variety of recession prediction models, and the government of course publishes an index of leading economic indicators. We review these periodically, and at the moment none of them are flashing red, save one by 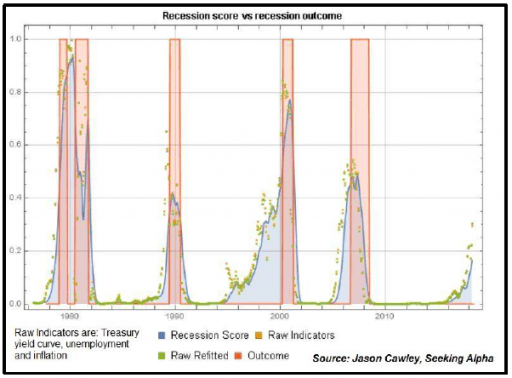 Jason Cawley shown in the graph nearby. Even Jason’s puts the immediate risk at only 16%, and he and most analysts are putting the date of the next recession in late 2019 or 2020, conveniently timed for the next presidential election! Many if not most of these predictive models will fail to warn us in time, most likely because they aren’t measuring the thing or things that will be the next trigger, nor are they tracking the elements of the bubble that will burst.
A couple of the analysts whom we read most frequently think the bubble that bursts will be the corporate debt market. Indeed, US corporate debt measured as a percentage of GDP has reached the high levels which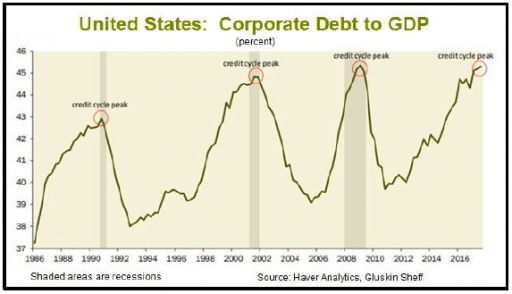 historically have been coincident with all of the three most recent recessions (see chart on the next page). There is also significant concern among not only analysts but also bank regulators that there is insufficient liquidity in the corporate bond markets, in large part as a result of Dodd Frank regulations which strongly discourage banks from making markets in corporate debt securities. The lack of liquidity means that the bubble is more likely to burst rather than deflate slowly. To quote one of our favorite analysts, John Mauldin, “There is a new class of (bond) investors …….. corporate bond ETF and mutual fund shareholders. These funds have exploded in size (high yield alone is now around $2 trillion) and their design presumes a market with ample liquidity. We barely have such a market right now, and we certainly won’t have one after rates jump another 50–100 basis points.” As detailed above, the spread between corporate yields and Treasury yields is very near cycle lows, but if selling pressure builds and there is a liquidity squeeze in the market, spreads will likely snap wider in a hurry. A severe liquidity squeeze for corporations was a central feature in the global financial crisis late last decade, perhaps second only to the mortgage market meltdown. So far no one is predicting a repeat, but the high debt levels will reverse at some point, and there will undoubtedly be some pain associated with that reversal.
Speaking of the mortgage crises, could sub-prime auto loans be a trigger for the next calamity, or perhaps just the canary in the coal mine as we breeze on by. While considerably smaller than the $1.3 trillion US sub-prime mortgage market was in 2007, the 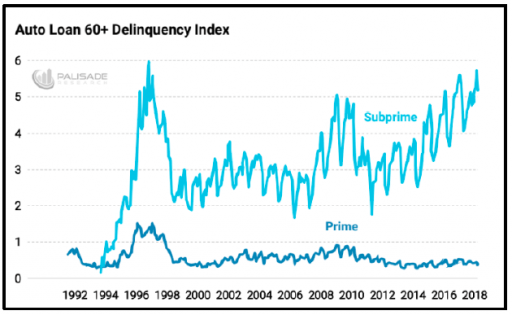 current $280 billion sub-prime auto loan market is experiencing its highest delinquency rates since 2010 at 9%. As of the end of 2017, according to the New York Fed Consumer Credit Panel/Equifax, there are 6.3 million Americans who are 90 days or more past due on their auto loan payments. The trend is not positive, as can be seen in our last chart for this report. Hopefully this is a problem that is “contained.”